
Home / Resources / Psychological Measures / WEMWBS
WEMWBS:
Scoring and Interpretation
The Warwick-Edinburgh Mental Well-Being Scale (WEMWBS) is a 14-item self-report measure of positive mental well-being, with a 7-item short form (SWEMWBS). WEMWBS scoring is a simple 14 to 70 sum for the full form, but the short form needs the published conversion, so the sections below explain the two metrics, why clinical cutoffs do not apply, and how to compute the full-form total in SPSS or R.
What the WEMWBS Measures
Tennant and colleagues developed the scale to monitor well-being in the general population, not to diagnose a psychiatric condition, so its items cover feelings and everyday functioning over the past two weeks without symptom or deficit language (Tennant et al., 2007).
In research it serves as an outcome in public health, university, community and intervention studies. The seven-item SWEMWBS has its own psychometric rationale, grounded in Rasch analysis, and its raw total must not be reported as though it were the same metric as the 14-item total (Stewart-Brown et al., 2009).
Structure of the WEMWBS
- Items: fourteen positively worded statements, each rated on five options coded 1 to 5.
- Subscales: none. The standard output is one well-being total.
- Direction: no reverse-scored items in the standard full form. Higher scores mean greater well-being.
- Short form: SWEMWBS uses seven of the items and its raw sum must be converted with the published Warwick conversion table before comparison with metric scores.
- Translations: the scale originates in the UK. Cite the validation of any translation used, and name the language and its source.
The instrument itself is available from the University of Warwick (Warwick Innovations).
How to Score the WEMWBS
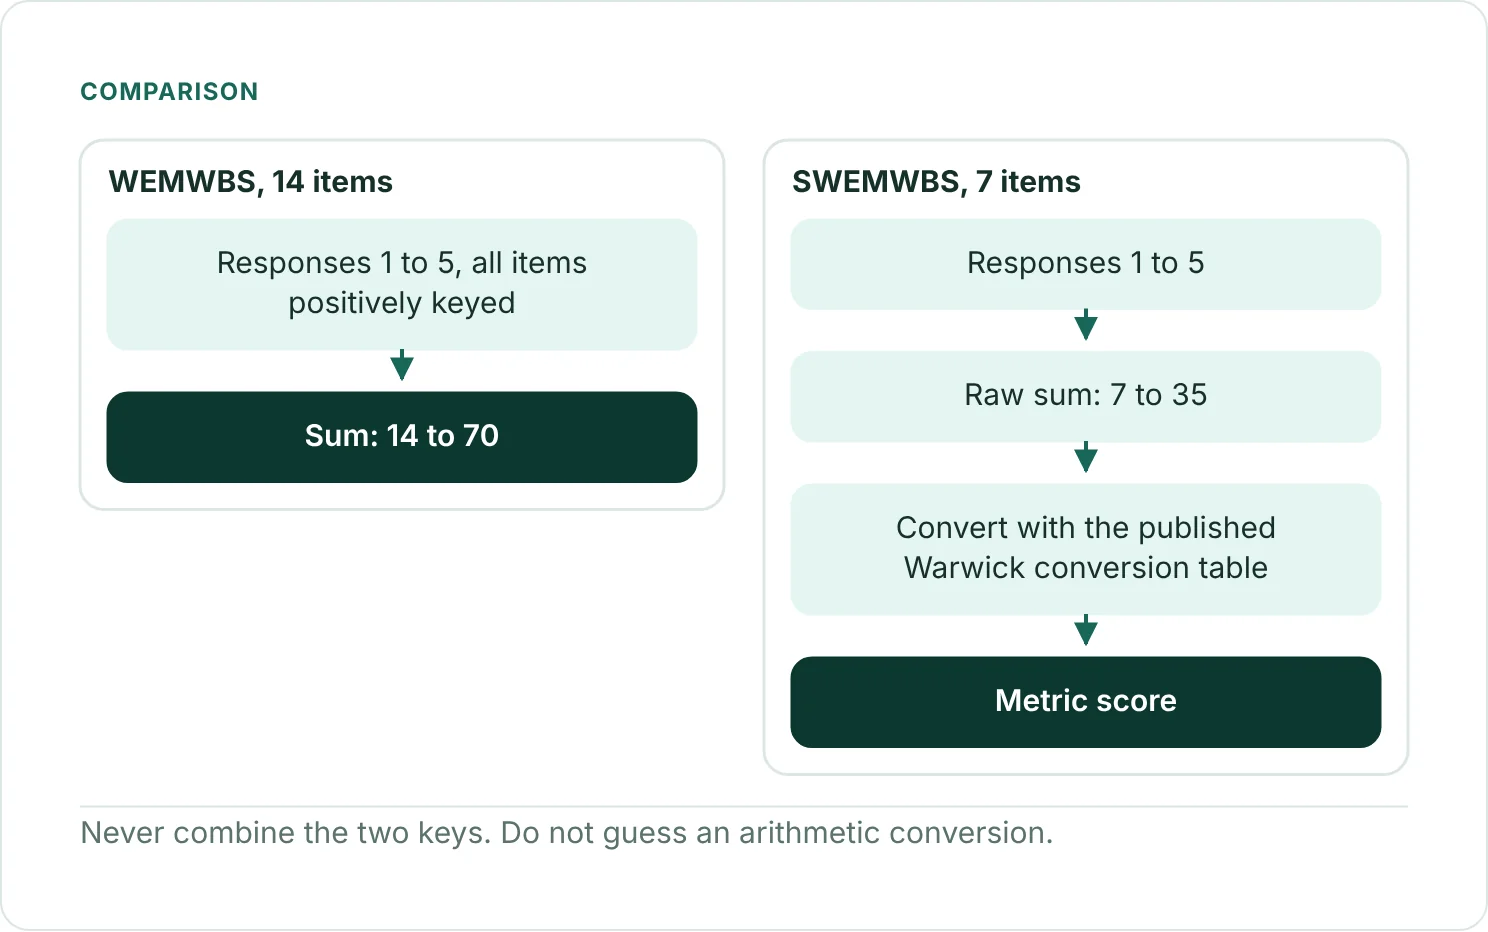
- Confirm whether the dataset holds the 14-item WEMWBS or the 7-item SWEMWBS, and never combine the two keys.
- For the full form, verify that wem1 to wem14 are coded 1 to 5, then sum all 14 responses to obtain wemwbs_total, which ranges from 14 to 70.
- If any item is missing, keep the total missing unless the study protocol specifies another rule. No universal prorating rule was verified, so report whichever rule you apply.
- For SWEMWBS, sum the seven short-form items (raw 7 to 35) and transform the raw score with the Warwick conversion table. Do not guess an arithmetic conversion.
- Document the translation, the time point and which score metric is analyzed.
* Illustrative syntax: wem1 to wem14 coded 1 to 5, complete cases only.
COMPUTE wemwbs_total = SUM.14(wem1 TO wem14).
EXECUTE.
* SWEMWBS requires the published raw-to-metric conversion table, not computed here.# data: one row per respondent; items wem1 to wem14 coded 1 to 5.
items <- paste0("wem", 1:14)
stopifnot(all(vapply(data[items], function(z) all(is.na(z) | z %in% 1:5), logical(1))))
data$wemwbs_total <- ifelse(complete.cases(data[items]), rowSums(data[items]), NA_real_)
# SWEMWBS: apply the developer's raw-to-metric table separately.Interpreting WEMWBS Scores
| Score | Interpretation |
|---|---|
| 14 to 70 (full form) | Continuous self-reported mental well-being; higher = more positive well-being |
| 7 to 35 raw (short form) | Raw sum only; convert with the Warwick table before using metric scores |
| Clinical severity bands | None verified for this instrument; do not transfer cutoffs from symptom measures |
Source: Tennant et al. (2007); Stewart-Brown et al. (2009).
Higher complete WEMWBS totals indicate more positive self-reported mental well-being. Comparisons with published norms require the same version and a comparable population. The scale was not designed as a depression screen or a diagnostic test, so a low score is not a diagnosis (Tennant et al., 2007).
These are research measurement scores and not individual clinical classifications. Read group differences and change against the design, confidence intervals, version and missing data. A high or low number does not by itself establish a causal explanation.
Psychometric Properties
| Property | Published finding | Source |
|---|---|---|
| Internal consistency | Cronbach’s alpha of .89 in the student sample and .91 in the population sample | Tennant et al. (2007) |
| Test-retest | Intraclass correlation of .83 over one week | Tennant et al. (2007) |
| Structure | Confirmatory factor analysis supported a single general factor | Tennant et al. (2007) |
| Short form | Rasch analysis informed the seven-item version, whose raw scores need the published conversion | Stewart-Brown et al. (2009); Warwick Innovations (n.d.) |
These are source-specific findings and cannot be assumed to hold as reliability estimates in a new sample.
Using the WEMWBS in a Study
As an outcome, state whether the question concerns a between-group difference, within-person change or a population trend. A linear mixed model can handle repeated WEMWBS measurements, whereas a cross-sectional comparison may use regression when its assumptions suit the data. No generic minimal clinically important difference is established here, so interpret change with its confidence interval and your own anchor.
Estimate reliability in your own sample, and check measurement invariance before comparing languages or demographic groups. If you analyze the short form, say whether you used the converted metric score, and keep it separate from the full-form total.
Reporting the WEMWBS
Mental well-being was measured with the [14-item WEMWBS or 7-item SWEMWBS] (Tennant et al., 2007). Items refer to the preceding two weeks. [Full-form totals or converted short-form metric scores] were analyzed as [outcome type]. Internal consistency in this sample was [alpha or omega = value], and missing items were handled by [prespecified rule].
References
Stewart-Brown, S., Tennant, A., Tennant, R., Platt, S., Parkinson, J., & Weich, S. (2009). Internal construct validity of the Warwick-Edinburgh Mental Well-being Scale (WEMWBS): A Rasch analysis using data from the Scottish Health Education Population Survey. Health and Quality of Life Outcomes, 7, Article 15. https://doi.org/10.1186/1477-7525-7-15
Tennant, R., Hiller, L., Fishwick, R., Platt, S., Joseph, S., Weich, S., Parkinson, J., Secker, J., & Stewart-Brown, S. (2007). The Warwick-Edinburgh Mental Well-being Scale (WEMWBS): Development and UK validation. Health and Quality of Life Outcomes, 5, Article 63. https://doi.org/10.1186/1477-7525-5-63
Warwick Innovations. (n.d.). WEMWBS: How it works. University of Warwick.
Frequently Asked Questions
Is the WEMWBS a depression screening tool?
No. It measures positive mental well-being, and depression screening needs an appropriately validated screening instrument.
Can I compare WEMWBS-14 totals with SWEMWBS totals?
Not directly. The two forms use different score distributions, and the short form needs the developer’s metric conversion.
Are any WEMWBS items reverse scored?
No. The standard 14-item form has no reverse scoring.
Does a higher score show an intervention worked?
Not by itself. Judge change against the design, the comparator, the uncertainty and the prespecified outcome.
NEXT STEP
Need WEMWBS Data Scored
or Checked?
OnlineSPSS is a statistical consultancy for researchers. Share your design and dataset, and a statistically trained Research Coordinator reviews it. The scope and one fixed project fee are confirmed before work begins.
No Commitment Required
Strictly Confidential
Fixed Project Fee
In-House PhD-Level Statisticians
Same-Day Response
Serving Researchers Since 2014