
Sample Size for Survival Analysis and Cox Regression
Sample size for survival analysis depends heavily on the number of outcome events, not just the number of patients recruited. Sample-size planning therefore links an event requirement to expected event rates, accrual, follow-up and censoring. A two-group log-rank trial and a multivariable Cox prediction model require different planning approaches (Schoenfeld, 1983; Freedman, 1982; Riley et al., 2019).

Why people and events are different
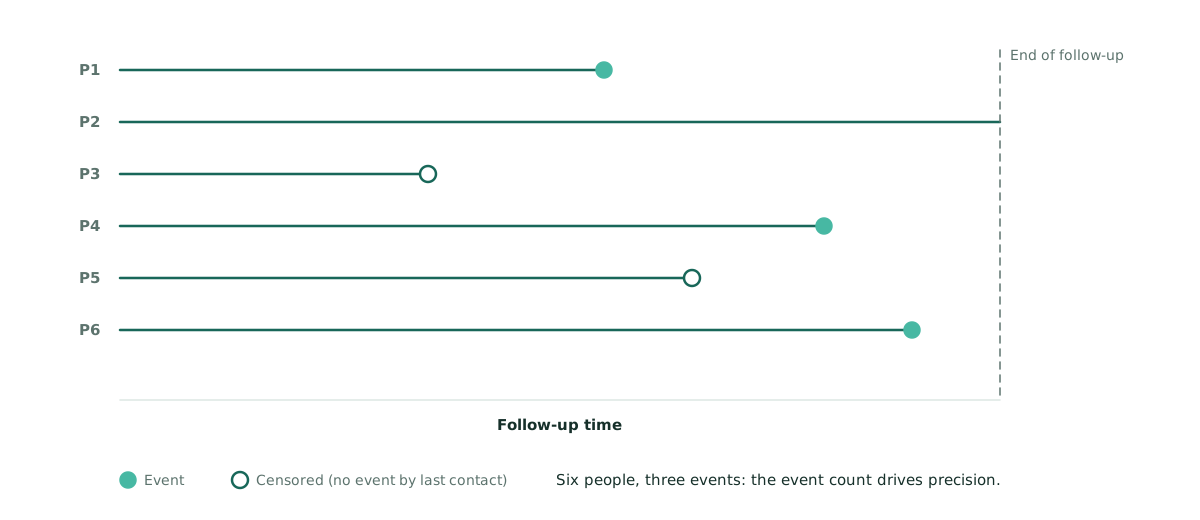
In a survival study, participants contribute varying follow-up time. One patient may have the event of interest; another may finish follow-up without the event; a third may leave the study. The latter two may be right-censored, which means the event time is only known to be later than the observed follow-up time under the standard interpretation.
A study with 1,000 participants and very few events may have less statistical power for a hazard comparison than a smaller study with many observed events. The relationship is not exact, and full information depends on design and covariates, but event numbers play a central role in classical log-rank and Cox calculations (Schoenfeld, 1983; Hsieh & Lavori, 2000).
First define your survival analysis question
| Research goal | Planning focus |
|---|---|
| Compare two survival curves | Target hazard ratio, type I error, power, group allocation and required events |
| Estimate survival at a fixed time | Precision of a survival probability, accounting for censoring |
| Estimate a specific Cox hazard ratio | Predictor distribution, log hazard ratio, covariate structure and event requirement |
| Develop a multivariable prognosis model | Candidate parameters, overfitting, predicted risks, model fit and events |
| Competing-risk outcome | Cumulative incidence or cause-specific/subdistribution estimand and corresponding design method |
These aims should not be reduced to one default “Cox regression sample size” button. Schoenfeld (1983) addressed proportional hazards tests; Riley et al. (2019) address multivariable prediction-model development with time-to-event outcomes.
Sample size for survival analysis: the two-group event requirement
Under proportional hazards, equal allocation, a two-sided test and the large-sample approximation for the log-rank/Cox treatment contrast, the required total number of events is approximately:
Here D is the total number of observed events required, π is the allocation proportion to one group, HR is the hypothesized hazard ratio between groups, α is the type I error rate and 1 − β is power. With equal allocation, π(1 − π) = 0.25. This is a simplified large-sample formulation; its validity depends on the study design and hazard assumptions (Schoenfeld, 1983; Freedman, 1982).
Suppose a study plans a two-sided comparison with HR = 0.75, equal allocation, α = .05 and power = 80%. These inputs are illustrative, not findings from a published trial.
- log(0.75) ≈ −0.28768; squaring gives approximately 0.08276.
- The normal-quantile sum is (1.960 + 0.842)² ≈ 7.85.
- D ≈ 7.85 / [0.25 × 0.08276] ≈ 379.4 events.
- Round up to 380 total events under the stated approximation.
This is an event target, not a recruitment target. If, solely for a teaching illustration, 40% of recruited participants would be expected to experience the event during available follow-up, a crude approximation is 380/0.40 = 950 participants. A real planning calculation must model recruitment, follow-up, event hazards, competing events and loss to follow-up; the 40% is hypothetical and may be unjustified in a real population.
Example in R
The event target and the crude conversion to participants take a few lines. All inputs are hypothetical, and the conversion is a teaching shortcut, not a recruitment plan.
# Hypothetical inputs
hr <- 0.75; alpha <- 0.05; target_power <- 0.80
alloc <- 0.5                 # proportion allocated to one arm

D <- (qnorm(1 - alpha / 2) + qnorm(target_power))^2 /
     (alloc * (1 - alloc) * log(hr)^2)
ceiling(D)                   # total events required

# Crude conversion if 40% were expected to have the event (hypothetical)
ceiling(D) / 0.40
How event targets become numbers of participants
The proportion expected to experience an event depends on the condition under study and observation period. A one-year follow-up may yield very different event counts from a five-year follow-up. Gradual recruitment also means later participants have less observation time. Censoring and competing outcomes can reduce observed events relative to simplistic projections (Freedman, 1982; Chow et al., 2017).
A defensible plan should specify accrual duration, minimum follow-up, event-rate assumptions, allocation, censoring and the primary survival estimand. If uncertainty is substantial, calculate sample sizes under alternative event-rate assumptions.
Cox regression with other predictors
Hsieh and Lavori (2000) developed sample-size considerations for Cox models with nonbinary covariates and adjustments for covariate correlations. Those calculations differ from the simple equal-arm log-rank example.
For development of a multivariable clinical risk prediction model, Riley et al. (2019) recommend addressing candidate predictor parameters, expected model fit, overfitting and overall risk precision. The event requirement for a two-group treatment test does not justify the development of a complex multivariable prognosis model.
Practical reporting paragraph
The primary endpoint was time from [origin] to [defined event], with [censoring rules]. Sample-size planning assumed [HR or target estimand], [allocation], two-sided α = [value], power = [value], and [method]. The calculation required [D] observed events. Based on [source] for expected hazards, recruitment over [duration], follow-up over [duration] and [censoring assumption], the enrollment target was [N]. Sensitivity analyses considered [alternative event and dropout assumptions].
Common mistakes
- Reporting only participant n, without the required event count.
- Choosing a hazard ratio without clinical or literature justification.
- Assuming all enrolled patients have complete and identical follow-up.
- Treating censoring as if it were the same as an observed event.
- Applying a simple log-rank formula to a multivariable prediction model.
- Ignoring non-proportional hazards or competing risks when central to the estimand.
Frequently asked questions
Is the number of events more important than the total number of patients?
For many hazard-based comparisons, the observed event count is a major information driver. The total enrolled sample still matters because it determines, with follow-up and hazards, how many events can occur (Schoenfeld, 1983).
Is Cox regression sample size the same as log-rank sample size?
Not necessarily. It depends on the inferential target and covariates. Two-group comparisons, adjusted association models and prediction-model development have distinct planning requirements.
Can I calculate the event requirement from a hazard ratio alone?
No. You must also supply a significance level, power, allocation and appropriate model assumptions; translating events to patient n additionally requires event and follow-up assumptions.
Research Planning & Study DesignPlanning a survival study or Cox model? A statistician builds the event target and the recruitment plan from your follow-up and censoring assumptions.
Research Planning & Study Design
Research Planning & Study Design at OnlineSPSS is carried out by in-house PhD-level statisticians. A statistically trained Research Coordinator reviews your request, and the analytical work, deliverables, timeline and fixed project fee are confirmed before work begins. The research question, interpretation and conclusions remain with you.
References
- Chow, S.-C., Shao, J., Wang, H., & Lokhnygina, Y. (2017). Sample size calculations in clinical research (3rd ed.). CRC Press. https://doi.org/10.1201/9781315183084
- Freedman, L. S. (1982). Tables of the number of patients required in clinical trials using the logrank test. Statistics in Medicine, 1(2), 121–129. https://doi.org/10.1002/sim.4780010204
- Hsieh, F. Y., & Lavori, P. W. (2000). Sample-size calculations for the Cox proportional hazards regression model with nonbinary covariates. Controlled Clinical Trials, 21(6), 552–560. https://doi.org/10.1016/S0197-2456(00)00104-5
- Riley, R. D., Snell, K. I. E., Ensor, J., Burke, D. L., Harrell, F. E., Jr., Moons, K. G. M., & Collins, G. S. (2019). Minimum sample size for developing a multivariable prediction model: Part II—Binary and time-to-event outcomes. Statistics in Medicine, 38(7), 1276–1296. https://doi.org/10.1002/sim.7992
- Schoenfeld, D. A. (1983). Sample-size formula for the proportional-hazards regression model. Biometrics, 39(2), 499–503. https://doi.org/10.2307/2531021
Last reviewed November 2026 by the OnlineSPSS Statistical Team. Worked examples use hypothetical values and are not client data.
NEXT STEP
Need this done for
your study?
Share your research in about a minute and receive a complimentary assessment the same day: scope, timeline and one fixed fee.
No Commitment Required
Strictly Confidential
Fixed Project Fee
In-House PhD-Level Statisticians
Same-Day Response
Serving Researchers Since 2014