
Reliability Analysis in SPSS
Video Walkthrough of a Worked Alpha Example
This reliability analysis in SPSS video estimates Cronbach's alpha for four Likert items about lecturers in a single dialog. The page adds what alpha does and does not show, how to read Item-Total Statistics and why alpha if item deleted is no instruction.
WATCH THE VIDEO
Reliability Analysis in SPSS, Start to Finish
Report alpha as an estimate of internal consistency with an interval, and do not present it as evidence of validity. Here alpha is .768 for four items and 198 cases, and an interval for it, estimated outside SPSS at 95% coverage, spans .71 to .82 (Feldt et al., 1987).
IN SHORT
What the Video Shows in Brief
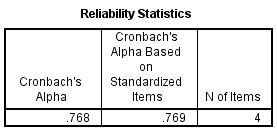
In this reliability analysis in SPSS video, four Likert items about lecturers (Empathy01 to Empathy04, coded 1 to 5) are analyzed with the Alpha model for 198 of 202 cases. The path is Analyze, Scale, Reliability Analysis. Cronbach’s alpha is .768, or .769 on standardized items, and deleting any one item would lower it.
BEFORE YOU RUN
Checks on Four Likert Items Before Reliability Analysis
Here are four points to settle about your study design and your data, each one ahead of running this reliability analysis in SPSS.
Items Scored in One Direction Alpha sums the items, so each must point the same way. A negatively worded item must be reverse-scored first, or its negative covariances pull alpha down, even below zero. All four lecturer statements here are worded positively.
Ordered Steps Treated as Numbers The items use five agreement steps, and alpha treats them as numbers. IBM's release 23 page accepts dichotomous, ordinal or interval data coded numerically. All four items here use all five steps.
One Dimension Assumed, Not Shown Alpha does not test whether the items form one dimension, because it is essentially unrelated to a test's internal structure (Sijtsma, 2009). That question belongs to a factor analysis of the same items.
Independent Respondents in Number Each respondent is one row, and 198 complete cases give a moderately wide interval for alpha. Respondents rating lecturers in one class share a context, so alpha describes that group more than a wider population.
STEP BY STEP
Entering Four Empathy Items in Reliability Analysis
Screens are pictured as they appear in IBM SPSS, and each numbered step below sets out the menu path, the settings to select and one check or tip.
The slides follow the step numbers, each one showing the SPSS screen for that step. The video was made in an older release, so some labels on your screen may differ.

Open the Reliability Analysis Dialog
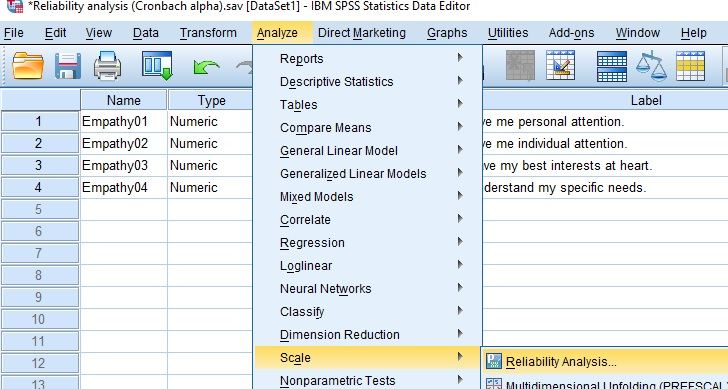
Choose Analyze, then Scale, then Reliability Analysis. In the video the Data Editor sits in Variable View behind the menu, listing Empathy01 to Empathy04, each with a label that holds the full statement.
Check: The Scale submenu also holds Multidimensional Unfolding and further procedures. Reliability Analysis is the entry that returns alpha for a set of items meant to form one scale.
Fill Items and Name the Scale Label
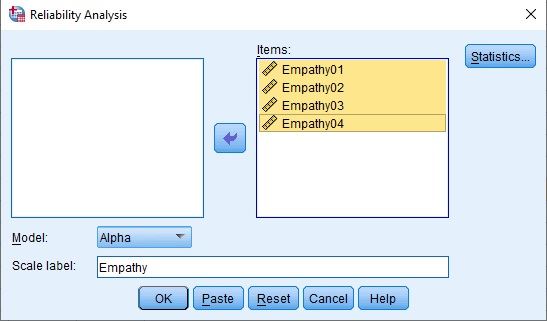
Move Empathy01, Empathy02, Empathy03 and Empathy04 into Items, keep Model on Alpha and type Empathy in Scale label. The Statistics button opens the table choices.
Tip: The Model list also offers Split-half, Guttman, Parallel and Strict parallel, each with its own assumptions. Alpha is the internal-consistency model and the one the video keeps.
Request Item and Scale Statistics
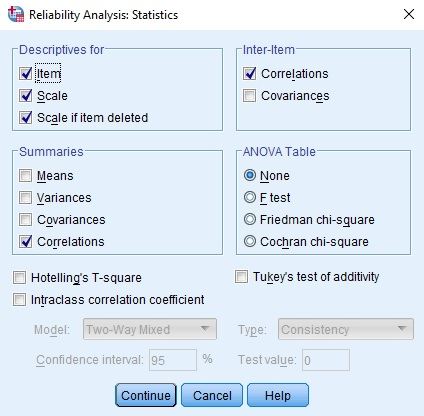
In Statistics tick Item, Scale and Scale if item deleted under Descriptives for, Correlations under Inter-Item and Correlations under Summaries. Then select Continue and OK.
Tip: Scale if item deleted is the box behind the Item-Total Statistics table. Without it, SPSS prints neither the corrected item-total correlation nor alpha if item deleted.
Find the Reliability Tables in the Viewer
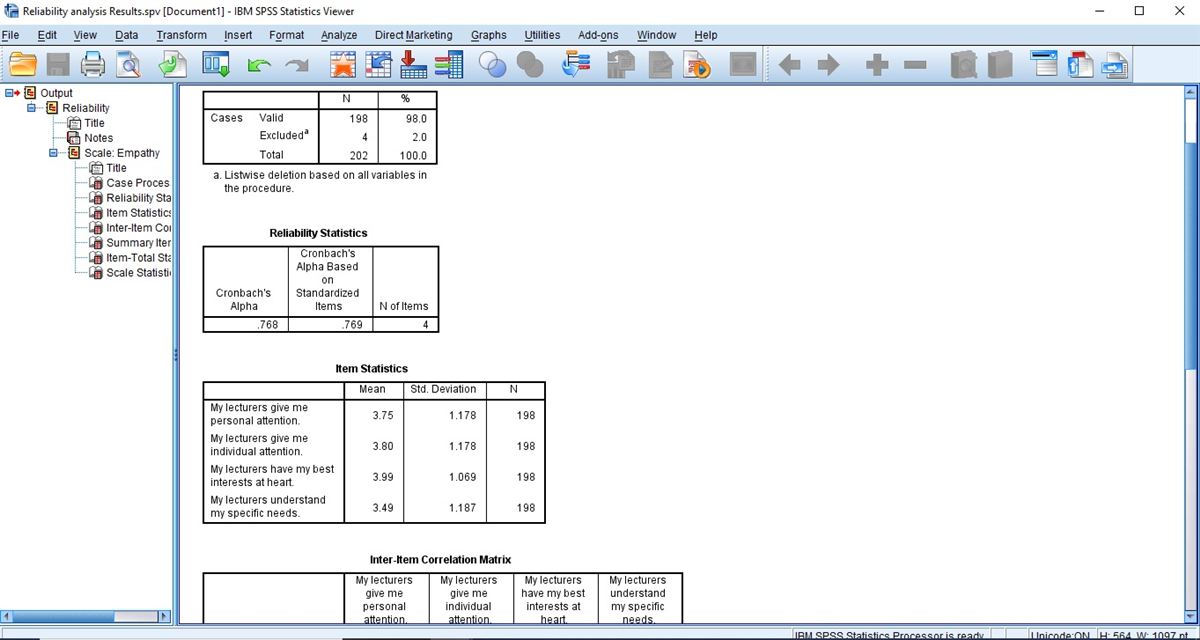
Under Scale: Empathy the outline names Case Processing Summary, Reliability Statistics, Item Statistics, Inter-Item Correlation Matrix, Summary Item Statistics, Item-Total Statistics and Scale Statistics. The screenshot is scrolled and shows only the first tables.
Watch: A scrolled Viewer hides the tables below it. Scroll to Item-Total Statistics and Scale Statistics before reading the result, because the item judgments come from those later tables.
Check the Cases, Then Read Alpha
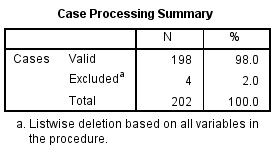
Case Processing Summary shows 198 valid cases, 4 excluded (2.0%) and 202 in total, with a listwise deletion note. Reliability Statistics gives Cronbach’s Alpha .768, Alpha Based on Standardized Items .769 and N of Items 4.
Check: Valid 198 and Excluded 4 add up to the 202 rows of the data file, and Item Statistics shows N = 198 for every item, which is what listwise deletion produces.
Read Item Statistics and the Correlations
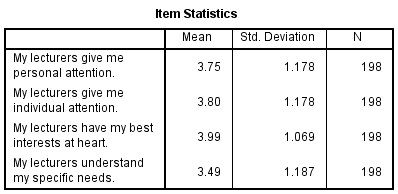
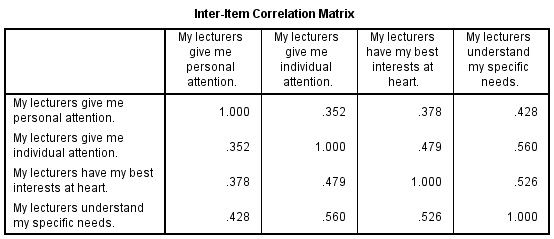
Item Statistics gives means from 3.49 to 3.99 and SDs from 1.069 to 1.187. The Inter-Item Correlation Matrix runs from .352 to .560, and Summary Item Statistics puts the mean of those correlations at .454.
Tip: The lowest correlation, .352, joins the first two items, which both ask about attention. A weak pair is worth reading against the item wording before any item is questioned.
Read Item-Total and Scale Statistics
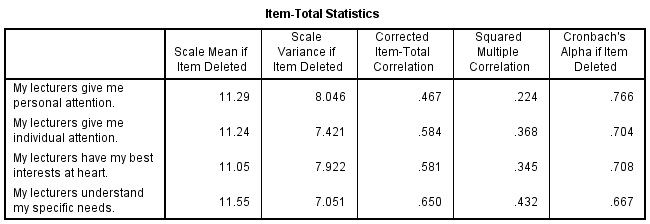
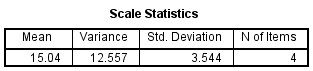
Item-Total Statistics gives corrected item-total correlations from .467 to .650 and Cronbach’s Alpha if Item Deleted from .667 to .766. Scale Statistics gives the summed scale a mean of 15.04, a variance of 12.557 and an SD of 3.544.
Watch: Set each Alpha if Item Deleted against the full-scale .768. The values .766, .704, .708 and .667 are all lower, so no single deletion raises alpha.
READING THE OUTPUT
Reading Alpha, Item-Total Statistics and Correlations
Row by row, the table names a value in the SPSS output for this reliability analysis, its figure in the video example and how to read it in your data.
| Output value | In the example | How to read it |
|---|---|---|
| Case Processing Summary | 198 valid, 4 excluded, 202 total | Listwise: one missing item removes the whole case from every table |
| Cronbach’s Alpha | .768 | An internal-consistency estimate for the four-item sum in these 198 respondents, printed without an interval |
| Alpha Based on Standardized Items | .769 | Alpha after z-scoring each item. It sits close to the raw value because the item SDs are similar |
| Inter-Item Correlations | .352 to .560, mean .454 | Pairwise correlations between items, all positive as alpha needs. The mean is in Summary Item Statistics |
| Mean and Std. Deviation | 3.49 to 3.99; 1.069 to 1.187 | Position and spread of each item in rating points, with N = 198 for every item |
| Corrected Item-Total Correlation | .467, .584, .581, .650 | Each item against the sum of the other three, so the item itself does not inflate the value |
| Cronbach’s Alpha if Item Deleted | .766, .704, .708, .667 | Alpha without that item. Each value is below the full-scale .768 here |
| Scale Statistics | Mean 15.04, variance 12.557, SD 3.544 | The sum of the four items per respondent, on a range from 4 to 20 |
COMMON MISTAKES
Slips With the Items Box, Alpha Versions and Missing Codes
The six slips below happen while setting up the data, working in the SPSS dialogs, reading the output or writing up, and each has a note on prevention.
A Total Score Placed Among the Items A computed total or mean of the scale moved into Items beside the statements raises alpha, because it correlates with every item by construction. Items takes the single statements only, here Empathy01 to Empathy04.
Two Scales in One Items Box Items takes one scale per run. Putting the items of two questionnaires into one box returns a single alpha for a mixed set, which describes neither. Run each scale with its own Scale label.
Standardized Alpha Quoted for a Raw Sum The table prints .768 and .769. The first matches a score made by adding or averaging the raw items, the second a score from standardized items. Quote the one that matches the score used later.
A Cutoff Applied Mechanically A floor of .30 for item-total correlations and .70 for alpha are conventions, not rules. Dropping an item shortens the scale and can narrow what it covers, so the item's content decides, with the table as evidence.
Scale Scores Built on Other Cases Reliability Analysis drops every case with a missing item, 4 of 202 here. A scale score built under another missing-data rule rests on different cases, and the reported alpha no longer matches the analyzed score.
A Skipped-Answer Code Counted as a Rating A code such as 9 for no answer enters as a rating unless it is declared missing, and it distorts variances and correlations. Check that each Item Statistics mean sits inside 1 to 5, as these do.
If you have already run this test, Independent Statistical Review has an OnlineSPSS statistician check the item direction, alpha and the wording against your output.
SOURCES
Sources and Further Reading
The reading below supports what this page says about this reliability analysis, and a line under each entry notes what to read it for.
Sijtsma, K. (2009). On the use, the misuse, and the very limited usefulness of Cronbach's alpha. Psychometrika, 74(1), 107-120. DOI: 10.1007/s11336-008-9101-0
Read this for why alpha says little about a test's internal structure.
Feldt, L. S., Woodruff, D. J., & Salih, F. A. (1987). Statistical inference for coefficient alpha. Applied Psychological Measurement, 11(1), 93-103. DOI: 10.1177/014662168701100107
Read this for confidence intervals and tests for coefficient alpha.
FREQUENTLY ASKED QUESTIONS
Menus, Item Deletion and Scale Length in the Example
Questions on this reliability analysis follow, from a screen that looks different in SPSS through the method and the video example to wording the result.
Why does the Reliability Analysis dialog look different in my SPSS?
The video was recorded in an older release of IBM SPSS Statistics. IBM’s release 23 page for Reliability Analysis lists five models, Alpha, Split-half, Guttman, Parallel and Strict parallel, and calls Alpha a model of internal consistency. The video keeps Alpha and uses the Statistics button for the item and scale tables.
Should the first item be dropped for its low correlations?
Not on this evidence. Empathy01 has the lowest corrected item-total correlation, .467, but its Alpha if Item Deleted of .766 is almost the full-scale .768, so removing it would leave alpha nearly unchanged and gain nothing. The item still correlates .352 to .428 with the others.
How do a mean correlation of .454 and four items give alpha?
Alpha rises with the number of items and with the mean inter-item correlation. Four items and a mean of .454 give the printed .769 on standardized items. Computed outside SPSS, the same mean correlation with eight items would give about .87, so alphas from short and long scales are not directly comparable.
How are alpha = .768 and its interval written up?
Name the scale, the items, the coefficient and the uncertainty. The four-item Empathy scale had Cronbach’s alpha = .77 (n = 198), 95% CI [.71, .82], an interval estimated outside SPSS, and corrected item-total correlations from .47 to .65. Add the item wording and the 4 cases excluded for a missing item.
NEXT STEP
Need a Scale's Internal Consistency
Run or Checked?
OnlineSPSS is a statistical consultancy for researchers. Share your design and dataset, and a statistically trained Research Coordinator reviews it. The scope and one fixed project fee are confirmed before work begins.
No Commitment Required
Strictly Confidential
Fixed Project Fee
In-House PhD-Level Statisticians
Same-Day Response
Serving Researchers Since 2014