Home / Resources / Psychological Measures / QIDS-SR16
QIDS-SR16:
Scoring and Interpretation
The Quick Inventory of Depressive Symptomatology, Self-Report (QIDS-SR16) is a 16-item questionnaire that rates the severity of depressive symptoms over the previous seven days. QIDS-SR16 scoring does not add the 16 items, because three groups of items contribute only their highest rating, and this guide sets out that domain rule, the resulting 0 to 27 total, the descriptive severity labels, SPSS and R code, and a model methods paragraph.
What the QIDS-SR16 Measures
Rush and colleagues evaluated the QIDS in clinician-rated and self-report forms in outpatients with chronic major depression, building the short inventory so that its items map onto the nine symptom domains used to define a major depressive episode (Rush et al., 2003). The total therefore tracks severity across the criterion symptoms, which makes it practical for treatment trials and measurement-based care.
In the original sample of 596 outpatients, Cronbach’s alpha for the self-report form was .86, and its total correlated .96 with the 30-item Inventory of Depressive Symptomatology self-report and .86 with the 24-item Hamilton Rating Scale for Depression (Rush et al., 2003). The score is a symptom-severity measure and not a diagnosis. One domain covers thoughts of death or suicide, so a study using it needs a safety protocol for relevant responses whatever the total.
Structure of the QIDS-SR16
- Items: sixteen self-report ratings from 0 to 3, each with its own ordered anchors. They are not generic agreement options.
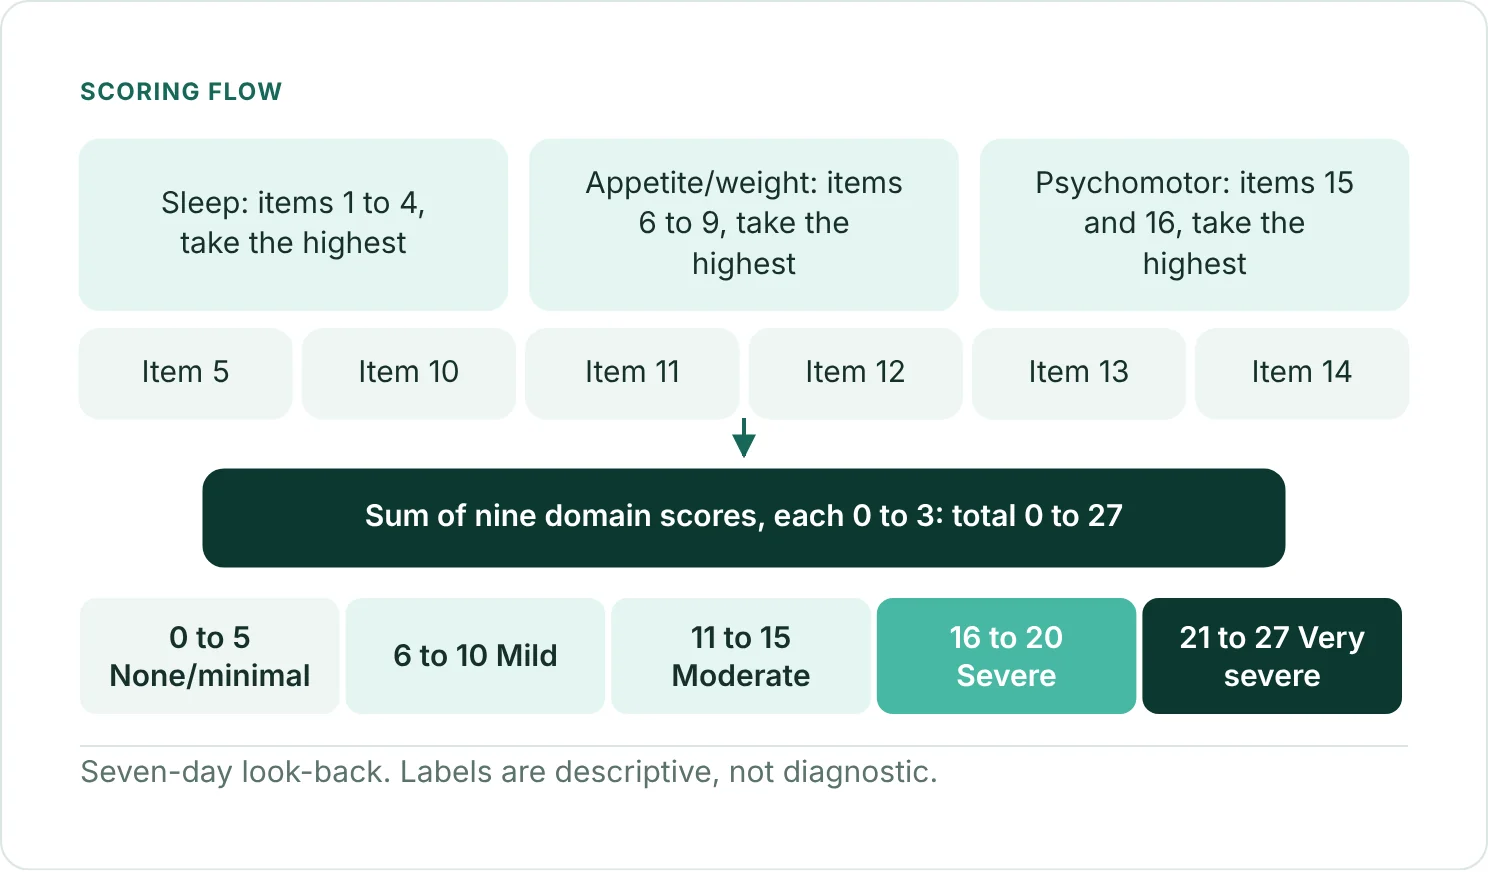
- Grouped domains: items 1 to 4 (sleep), items 6 to 9 (appetite and weight) and items 15 and 16 (psychomotor) each contribute only the highest rating in the group.
- Single-item domains: items 5, 10, 11, 12, 13 and 14, which together with the three grouped domains give nine domain scores.
- Total: the nine domain scores, each 0 to 3, summed to 0 to 27.
- Recall: the previous seven days.
- Versions: the clinician-rated QIDS-C16 and the 30-item IDS use different item numbering and should not be mixed with this scoring.
- Translations: use a validated version for the intended population and name the language and its source. If no validated translation exists, say so and describe how the version was adapted.
The instrument itself is available from the QIDS developers and the published description in Rush et al. (2003).
How to Score the QIDS-SR16
- Confirm that the variables follow the QIDS-SR16 item positions and that every value is a whole number from 0 to 3.
- Take the highest rating among items 1 to 4 for sleep, among items 6 to 9 for appetite and weight, and between items 15 and 16 for psychomotor change.
- Use items 5, 10, 11, 12, 13 and 14 as six separate domain scores, then sum the nine domain scores to obtain qids_total, which ranges from 0 to 27.
- Apply a missing-data rule. The example returns a missing total for any incomplete form. No developer-endorsed prorating rule was verified, so any other rule must be prespecified, justified and reported.
* Illustrative syntax: qids1 to qids16 hold ratings coded 0 to 3.
DO IF (NVALID(qids1 TO qids16) = 16).
  COMPUTE qids_sleep = MAX(qids1 TO qids4).
  COMPUTE qids_appwt = MAX(qids6 TO qids9).
  COMPUTE qids_psychomotor = MAX(qids15, qids16).
  COMPUTE qids_total = SUM(qids_sleep, qids5, qids_appwt, qids10, qids11, qids12, qids13, qids14, qids_psychomotor).
ELSE.
  COMPUTE qids_total = $SYSMIS.
END IF.
EXECUTE.# data: one row per respondent; items qids1 to qids16 coded 0 to 3.
items <- paste0("qids", 1:16)
score_qids <- function(x) {
if (anyNA(x) || any(!x %in% 0:3)) return(NA_real_)
max(x[1:4]) + x[5] + max(x[6:9]) + sum(x[10:14]) + max(x[15:16])
}
data$qids_total <- apply(data[items], 1, score_qids)Interpreting QIDS-SR16 Scores
| Score band | Interpretation |
|---|---|
| 0 to 5 | None or minimal |
| 6 to 10 | Mild |
| 11 to 15 | Moderate |
| 16 to 20 | Severe |
| 21 to 27 | Very severe |
Source: severity labels from the developers’ scoring guidance (IDS/QIDS, n.d.); instrument described by Rush et al. (2003). The labels are conventions and not diagnostic cutoffs.
Higher totals indicate more severe depressive symptoms in the past week. The continuous total usually carries more information than the bands, so use the labels as readable descriptors or secondary summaries and prespecify any response or remission definition. The bands do not confirm major depressive disorder and should not be assumed to transfer unchanged across populations.
A rating on the domain covering thoughts of death or suicide needs a study or clinical safety response regardless of the overall total. A low total does not remove that obligation.
Psychometric Properties
| Property | Published finding | Source |
|---|---|---|
| Sample | 596 outpatients with chronic, nonpsychotic major depression | Rush et al. (2003) |
| Internal consistency | Cronbach’s alpha .86 for the 16-item self-report form | Rush et al. (2003) |
| Concurrent validity | Total correlated .96 with the IDS self-report (30 items) and .86 with the 24-item HAM-D | Rush et al. (2003) |
| Change over treatment | Moved in step with the longer measures as symptoms improved | Rush et al. (2003) |
| Diagnostic accuracy | Severity labels do not by themselves confirm a diagnosis | Not established universally |
These are source-specific results from patients with chronic depression and cannot be assumed to hold as reliability or validity estimates in a new sample.
Using the QIDS-SR16 in a Study
Report baseline, follow-up and change in the derived 0 to 27 total with estimates and confidence intervals. Repeated-measures and mixed-effects models, or ANCOVA with baseline adjustment in a randomized design, fit most questions, and the choice depends on the design, the visit schedule and the missing-data mechanism. Prespecify any response or remission definition, and do not replace a continuous primary endpoint with the severity bands after the fact.
Check floor and ceiling effects in samples with very low or very high baseline symptoms, because the total is bounded at 0 and 27 and can be skewed in general-population data. Examine model residuals instead of categorizing by default. When reporting internal consistency, say whether it refers to the 16 raw items or to the nine domain scores, since they are different scoring models. Base sample size on a justified mean difference and a plausible standard deviation, not on the theoretical range.
Related guides: Linear Mixed Models (Multilevel Modeling) · ANCOVA · Missing Data Analysis · Psychology & Behavioral Sciences
Reporting the QIDS-SR16
Depressive symptom severity over the previous seven days was measured with the 16-item Quick Inventory of Depressive Symptomatology, Self-Report (QIDS-SR16; Rush et al., 2003). Nine domain scores were computed using the highest rating within the sleep, appetite and weight, and psychomotor item groups and were summed (range = 0 to 27), with higher scores indicating greater severity. Missing items were handled by [method]. Internal consistency in the present sample was [coefficient and method], and the total was analyzed [continuously or using prespecified severity labels].
References
Rush, A. J., Trivedi, M. H., Ibrahim, H. M., Carmody, T. J., Arnow, B., Klein, D. N., Markowitz, J. C., Ninan, P. T., Kornstein, S., Manber, R., Thase, M. E., Kocsis, J. H., & Keller, M. B. (2003). The 16-item Quick Inventory of Depressive Symptomatology (QIDS), clinician rating (QIDS-C), and self-report (QIDS-SR): A psychometric evaluation in patients with chronic major depression. Biological Psychiatry, 54(5), 573-583. https://doi.org/10.1016/S0006-3223(02)01866-8
IDS/QIDS. (n.d.). Inventory of Depressive Symptomatology and Quick Inventory of Depressive Symptomatology [Developer website].
Frequently Asked Questions
Why do 16 items produce a total of 0 to 27?
The ratings are reduced to nine domains. Six items are scored singly, and three groups of items contribute only their highest rating, which gives nine domain scores of 0 to 3.
Can I sum all 16 items?
No. A raw item sum does not give the published QIDS-SR16 score, and the severity labels do not apply to it.
What counts as a clinically meaningful change?
Use the response definition prespecified for your study and supported by validation evidence for your population. This page does not assert a universal point threshold.
Does a high score diagnose depression?
No. It measures symptom severity, and a diagnostic assessment is a separate clinical process.
NEXT STEP
Need QIDS-SR16 Scoring Set Up
or Checked?
OnlineSPSS is a statistical consultancy for researchers. Share your design and dataset, and a statistically trained Research Coordinator reviews it. The scope and one fixed project fee are confirmed before work begins.
No Commitment Required
Strictly Confidential
Fixed Project Fee
In-House PhD-Level Statisticians
Same-Day Response
Serving Researchers Since 2014