
Home / Resources / Psychological Measures / Pain Catastrophizing Scale
Pain Catastrophizing Scale:
Scoring and Interpretation
The Pain Catastrophizing Scale (PCS) is a 13-item self-report measure of rumination, magnification and helplessness in response to pain. Pain Catastrophizing Scale scoring is a plain sum, but the subscale item numbers are interleaved, so this guide covers the structure, the 0 to 52 total, how to read elevated scores, SPSS and R code, and reporting wording.
What the Pain Catastrophizing Scale Measures
Sullivan, Bishop and Pivik (1995) developed and validated the PCS to capture catastrophizing as a set of exaggerated negative thoughts and feelings that accompany actual or anticipated pain. Respondents think of past painful experiences and rate how often each of 13 thoughts or feelings occurs, from 0 (not at all) to 4 (all the time).
The score describes a cognitive and emotional response to pain. It is not a measure of pain intensity, it does not establish a pain diagnosis, and it should be analyzed next to intensity and functional outcomes whenever the research question concerns pain-related disability.
Structure of the PCS
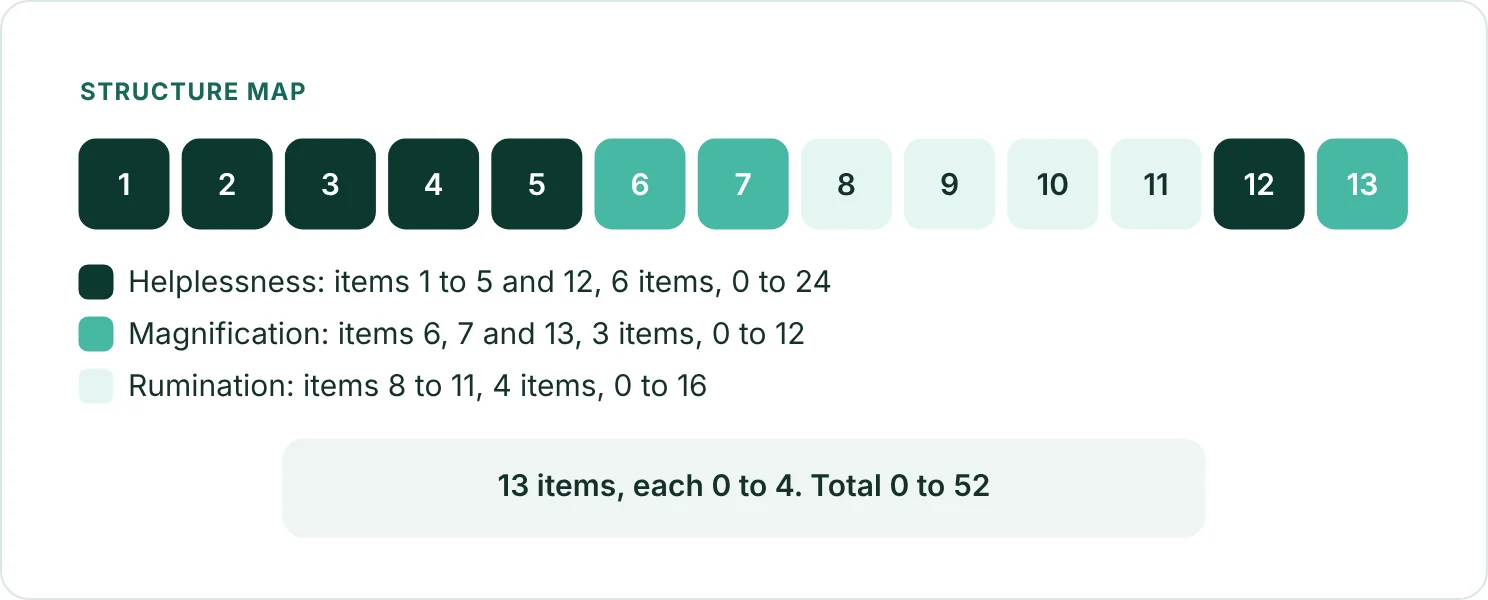
- Items: thirteen self-report statements, each rated from 0 to 4.
- Subscales: helplessness (items 1 to 5 and 12), magnification (items 6, 7 and 13) and rumination (items 8 to 11), using the original numbering. The interleaving makes mix-ups easy, so check your form against this list.
- Direction: no reverse-scored items. Higher scores mean more catastrophizing.
- Total: the standard summary is the sum of all 13 items, with subscale sums reported where the research question needs them.
- Translations: cite the validation study for the language administered and state its source. Where none exists, say so and describe how the wording was adapted, since pain vocabulary does not always translate directly.
The item wording and scoring structure are described in Sullivan et al. (1995).
How to Score the PCS
- Confirm that every response is an integer from 0 to 4 and that the item order matches the original numbering.
- Sum items 1 to 13 to obtain pcs_total, which ranges from 0 to 52.
- If subscales are needed, sum items 8 to 11 (rumination, 0 to 16), items 6, 7 and 13 (magnification, 0 to 12) and items 1 to 5 and 12 (helplessness, 0 to 24).
- Apply a missing-item rule set by the protocol. No developer-endorsed prorating rule was verified, so the code below requires complete responses. Report how missing items were handled.
* Illustrative syntax: pcs1 to pcs13 hold responses coded 0 to 4 in the original item order.
COMPUTE pcs_total = SUM.13(pcs1 TO pcs13).
COMPUTE pcs_rumination = SUM.4(pcs8 TO pcs11).
COMPUTE pcs_magnification = SUM.3(pcs6, pcs7, pcs13).
COMPUTE pcs_helplessness = SUM.6(pcs1 TO pcs5, pcs12).
EXECUTE.# data: one row per respondent; items pcs1 to pcs13 coded 0 to 4.
items <- paste0("pcs", 1:13)
data$pcs_total <- rowSums(data[items], na.rm = FALSE)
data$pcs_rumination <- rowSums(data[paste0("pcs", 8:11)], na.rm = FALSE)
data$pcs_magnification <- rowSums(data[paste0("pcs", c(6, 7, 13))], na.rm = FALSE)
data$pcs_helplessness <- rowSums(data[paste0("pcs", c(1:5, 12))], na.rm = FALSE)Interpreting PCS Scores
| Score band | Interpretation |
|---|---|
| 0 to 52 | Continuous catastrophizing; higher = more catastrophic pain-related thinking |
| Elevated-score cutoffs | Use only if a publication for your population and version supports the value |
| Universal diagnostic threshold | None verified |
Source: Sullivan et al. (1995); no universal diagnostic threshold was verified.
Higher totals indicate more catastrophic thinking about pain. Cutoffs for an elevated score have been derived from particular reference samples, so they describe position within those samples and not a clinical boundary. Where a threshold is used, give its source, the population it came from and the reason it suits your sample.
A total score does not identify a condition or a risk level. Interpret it with pain intensity, function and context, and avoid presenting a cutoff as a stand-alone classification.
Psychometric Properties
| Property | Published finding | Source |
|---|---|---|
| Original development | Thirteen-item scale with three correlated facets of catastrophizing | Sullivan et al. (1995) |
| Internal consistency | Estimate alpha or omega in your own sample, with a confidence interval | Study-specific |
| Test-retest stability | Report only with a documented interval; no universal coefficient is assumed | Study-specific |
| Cross-population validity | Check language and clinical-group equivalence before transferring thresholds | Version-specific research |
These are source-specific findings and cannot be assumed to hold as reliability or accuracy estimates in a new sample.
Using the PCS in a Study
Treat the total as a continuous outcome, predictor or covariate, and inspect its distribution before choosing a model, because sums of ordinal items are bounded at 0 and 52 and often skew in community samples. Linear or generalized linear models suit cross-sectional questions, and a mixed-effects model suits repeated assessments. Pair the score with pain intensity and function so that catastrophizing is not confused with severity.
If subscales are analyzed, state whether the hypotheses were about the facets or the total, and adjust for multiplicity accordingly. Estimate internal consistency in your own data and report it with its confidence interval. Base the sample size on the primary contrast or model, not on the number of items.
Reporting the PCS
Pain-related catastrophizing was measured with the 13-item Pain Catastrophizing Scale (PCS; Sullivan et al., 1995). Each item was rated from 0 to 4, and ratings were summed to a total score (range = 0 to 52), with higher scores indicating greater catastrophizing. Subscale scores were [used or not used]. Missing responses were handled by [method]. Internal consistency in the present sample was [alpha = XX, 95% CI XX to XX]. The statistical model was [model] with [covariates].
References
Sullivan, M. J. L., Bishop, S. R., & Pivik, J. (1995). The Pain Catastrophizing Scale: Development and validation. Psychological Assessment, 7(4), 524-532. https://doi.org/10.1037/1040-3590.7.4.524
Frequently Asked Questions
Which items belong to which PCS subscale?
Using the original numbering, helplessness is items 1 to 5 and 12, magnification is items 6, 7 and 13, and rumination is items 8 to 11.
Does a high PCS score indicate a pain disorder?
No. It describes a pattern of pain-related thinking and does not establish a diagnosis. Pain intensity and function need separate measurement.
Is there a single cutoff for elevated catastrophizing?
No universal value was verified. Published cutoffs come from specific reference samples, so cite the source and population for any threshold you use.
How should I handle a missing item?
Zero is a valid PCS rating, so a blank scored as zero lowers both the total and the subscale the item belongs to. Set the missing-item rule in the protocol and report how many respondents it affected.
NEXT STEP
Need PCS Data Scored
or Checked?
OnlineSPSS is a statistical consultancy for researchers. Share your design and dataset, and a statistically trained Research Coordinator reviews it. The scope and one fixed project fee are confirmed before work begins.
No Commitment Required
Strictly Confidential
Fixed Project Fee
In-House PhD-Level Statisticians
Same-Day Response
Serving Researchers Since 2014