
Mann-Whitney U Test in SPSS
Video Walkthrough of a Worked Math Score Example
This Mann-Whitney U test in SPSS video asks whether math scores tend to be higher for 12 female than 13 male participants. The page adds what the test compares, which p-value to quote and how to read .66, the probability of superiority.
WATCH THE VIDEO
Mann-Whitney U Test in SPSS, Start to Finish
Decide before the output what the Mann-Whitney U test is asked to compare. It asks whether scores in one group tend to be larger than in the other, and it supports a statement about medians only when the two distributions have the same shape (Divine et al., 2018; Hart, 2001). In this example the male scores spread wider, from 8 to 100 against 63 to 100, so the result is worded as a tendency, not as a median gap.
IN SHORT
What the Video Shows in Brief
In this Mann-Whitney U test in SPSS video, math test scores (1 to 100) are compared between 13 male and 12 female participants, coded 1 and 2. The path is Analyze, Nonparametric Tests, Legacy Dialogs, 2 Independent Samples, then Define Groups. The mean ranks are 11.08 and 15.08; U = 53.000, Z = -1.362, asymptotic p = .173 and exact p = .186: not statistically significant, which gives no evidence against equal distributions.
BEFORE YOU RUN
Independence, Order, Shape and Ties Before Ranking
Each of the four points below is a check on the study design or the data, made before any output is produced in SPSS.
Independent Participants Each participant sits in one gender group and is measured once, which the design settles. The same participants measured twice call for the Wilcoxon signed-rank test, and participants nested in classrooms for a clustered model.
Scores With an Order The math score from 1 to 100 has a meaningful order, and ranks use nothing more. A failed normality test is not a sound reason to choose this test; an ordinal outcome, or doubts about means, is.
Shapes and Spread Draw a histogram or boxplot of the scores in each group. Unequal spread or skew can distort the Type I error rate of the large-sample version more than is often assumed (Fagerland & Sandvik, 2009).
Scores That Repeat Math scores are whole numbers, and 100 appears three times, so ties are certain. Tied scores share an average rank, and the two p-values in the output do not treat them in the same way.
STEP BY STEP
Defining Gender Groups in Two-Independent-Samples Tests
Screenshots of IBM SPSS show what you will see along the way. The numbered steps below give the menu path and the settings, each with a check or a tip.
Each numbered slide captures what SPSS displays at one step of the Mann-Whitney test. The recording comes from an older release, so a few labels may not match your version.
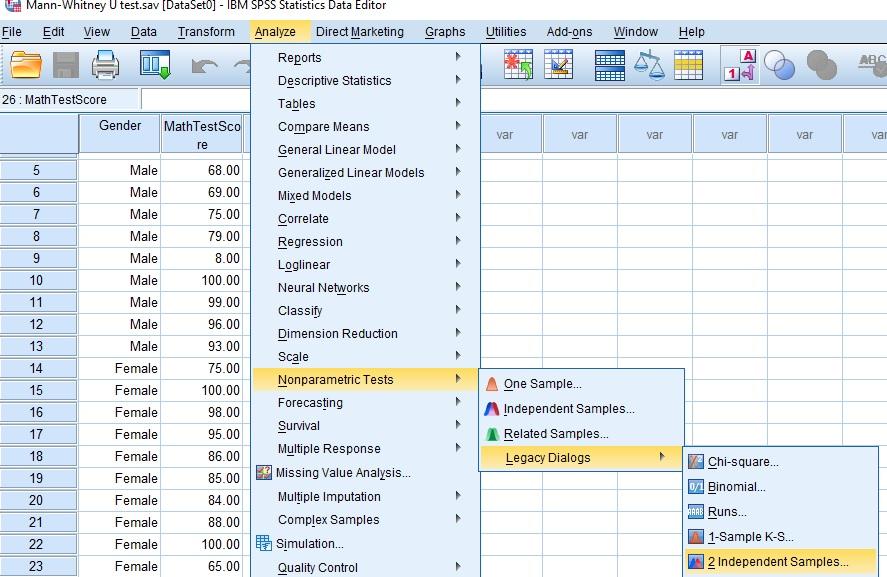

Open the 2 Independent Samples Dialog
Open the Analyze menu, then Nonparametric Tests and Legacy Dialogs, and select 2 Independent Samples. The video works in the legacy list, where each rank test has a dialog named for its design.
Check: Two groups of different participants belong here. Three or more groups go to K Independent Samples, the next entry in the same list.
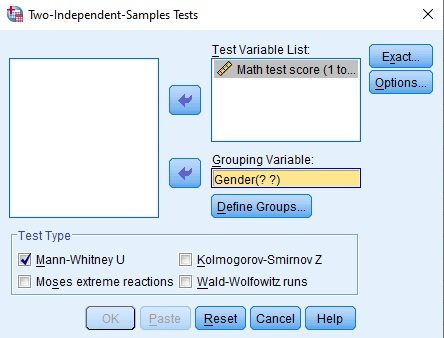
Place Math Score and Gender in the Dialog
Move the math score into Test Variable List and Gender into Grouping Variable, where it reads Gender(? ?) until the codes are set. Mann-Whitney U is ticked under Test Type, with three other tests beside it.
Watch: Moses extreme reactions, Kolmogorov-Smirnov Z and Wald-Wolfowitz runs answer other questions, such as spread or the whole distribution. Only Mann-Whitney U matches the question asked here.
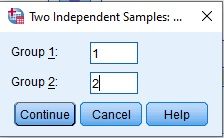
Enter Codes 1 and 2 in Define Groups
In Define Groups, type 1 in the Group 1 box and 2 in the Group 2 box, and close it with Continue. Gender carries the value labels 1 Male and 2 Female, so these codes match the data.
Watch: The order of the codes sets only the order of the rows in the Ranks table. Reversing them leaves U and p unchanged, so the direction is read from the mean ranks.
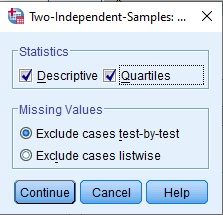
Ask Options for Descriptive and Quartiles
Open Options and tick Descriptive and Quartiles. The Missing Values choice stays on Exclude cases test-by-test, and Continue, then OK, starts the run.
Tip: Quartiles are the 25th, 50th and 75th percentiles of all 25 scores together, not of each group. Medians by group come from a separate summary step, such as Explore.
Check 13 Male and 12 Female Cases
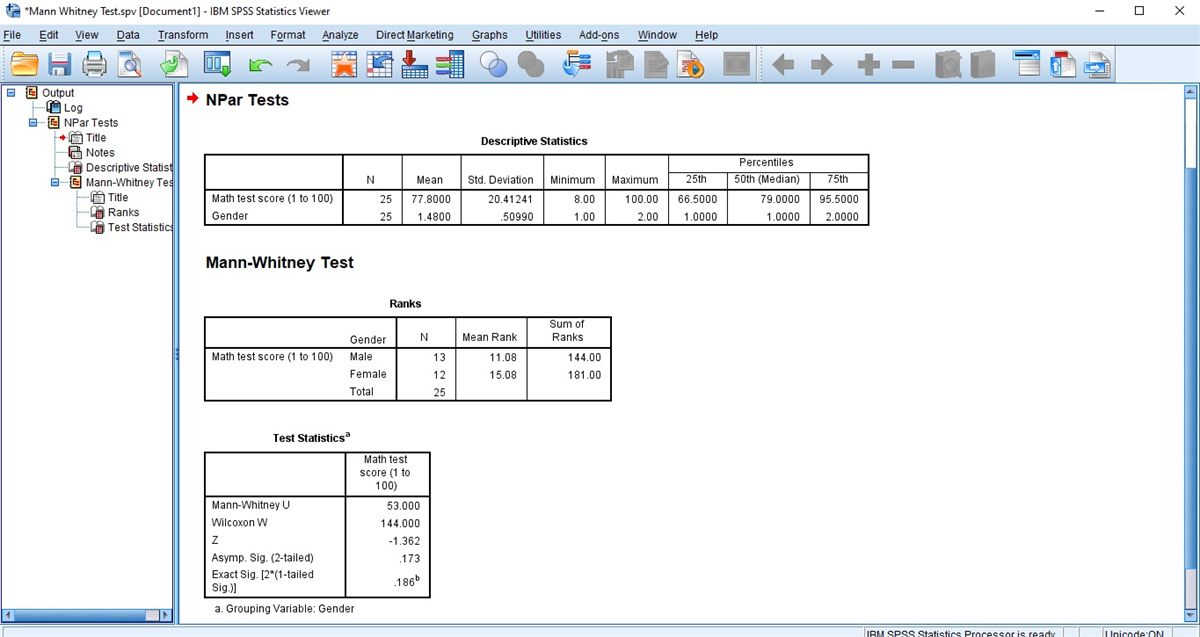
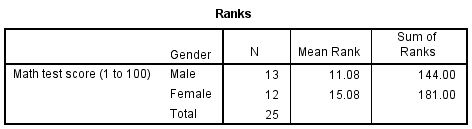
The Descriptive Statistics table comes first in the Viewer, followed by the Mann-Whitney Test with Ranks and Test Statistics. Read N in Ranks before any result: 13 male and 12 female participants make 25.
Check: Gender codes other than 1 and 2, such as a 9 for not stated, fall outside both groups, so those participants never reach the Ranks table.
Read the Descriptive Statistics Table
Descriptive Statistics lists N = 25, mean 77.80, standard deviation 20.41, minimum 8 and maximum 100 for the math score, with the percentiles 66.5, 79 and 95.5.
Watch: A minimum of 8 lies far below the next lowest score, 56. Ranks limit the pull of such a value, but check it against the source record first, since 80 typed as 8 would change its rank.
Read the Ranks and Test Statistics
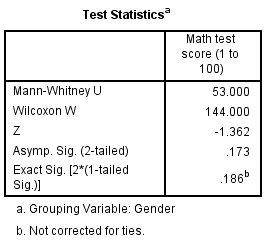
Ranks gives N, mean rank and sum of ranks for each group. Test Statistics gives U, Wilcoxon W, Z, Asymp. Sig. (2-tailed) and Exact Sig., with footnotes on the grouping variable and on ties.
Check: U = 53 counts the male-female pairs in which the male score is higher, ties counted half, out of 13 x 12 = 156. The other 103 favor the female score.
READING THE OUTPUT
Mean Ranks, U and the Two Significance Rows
Read the table one row at a time: a value from the SPSS output, the figure it takes in the video example, and how to read the same value in your data.
| Output value | In the example | How to read it |
|---|---|---|
| N, Mean, Std. Deviation | 25, 77.80, 20.41 | The math score of all participants together, in score points, not of each group |
| Minimum, Maximum, percentiles | 8, 100, and 66.5, 79 and 95.5 | The range, and the 25th, 50th (median) and 75th percentiles of the whole sample |
| N in Ranks | Male 13, Female 12 | Participants per group. Together they give the 25 in Descriptive Statistics |
| Mean Rank | Male 11.08, Female 15.08 | The average position of the group when all 25 scores are ordered together. The larger value marks the group that tends to score higher |
| Sum of Ranks | Male 144.00, Female 181.00 | Together 325.00, the sum of the positions 1 to 25 |
| Mann-Whitney U and Wilcoxon W | 53.000 and 144.000 | U is the smaller of the two possible values. W is the rank sum of the male group |
| Z and Asymp. Sig. (2-tailed) | -1.362 and .173 | The normal approximation of U, adjusted for ties, and its two-sided p-value |
| Exact Sig. [2*(1-tailed Sig.)] | .186 | The exact p-value. Footnote b states that it is not corrected for ties |
COMMON MISTAKES
Slips With W, Mean Ranks and a Halved p
Six mistakes follow, each tied to a stage (data setup, SPSS dialogs, output or write-up) and each paired with a brief note on how to avoid it.
A Large p Read as Equal Groups A p-value of .173 shows no evidence of a difference that these 25 participants can detect. That is no evidence that the groups score alike, and the mean ranks of 11.08 and 15.08 still differ.
U Reported Without Group Sizes U = 53 alone is hard to read, because its range depends on both group sizes. Give n = 13 and n = 12 with it, and add an effect size, since neither U nor p says how large the difference is.
Wilcoxon W Taken for the Signed-Rank Test The Wilcoxon W in Test Statistics is the rank-sum form of this same test, not the Wilcoxon signed-rank test for paired data. The write-up names a Mann-Whitney U test and quotes U.
Scores Split Into Two Columns Male and female scores typed in two side-by-side columns invite 2 Related Samples, which pairs row 1 with row 1 and ranks differences between strangers. Keep one score column and one Gender column, as the video's file does.
Mean Ranks Quoted as Scores The mean ranks of 11.08 and 15.08 are averages of positions from 1 to 25, not scores. Report them as average positions, never with score units such as points.
Halving .186 After Seeing the Ranks The Exact Sig. label, 2*(1-tailed Sig.), tempts a reader to halve .186 to .093 once the female mean rank is seen to be higher. A direction picked after the ranks are known does not make a one-tailed test.
If you have already run this test, Independent Statistical Review has an OnlineSPSS statistician check the exact p, the .66 and the wording against your output.
SOURCES
Sources and Further Reading
Every entry below supports a point made on this page. Read the short line beneath it to see what it is worth reading for.
Divine, G. W., Norton, H. J., Barón, A. E., & Juarez-Colunga, E. (2018). The Wilcoxon-Mann-Whitney procedure fails as a test of medians. The American Statistician, 72(3), 278-286. DOI: 10.1080/00031305.2017.1305291
Read this for what the rank-sum procedure tests instead of medians.
Hart, A. (2001). Mann-Whitney test is not just a test of medians: Differences in spread can be important. BMJ, 323(7309), 391-393. DOI: 10.1136/bmj.323.7309.391
Read this for how differences in spread can drive a Mann-Whitney result.
Fagerland, M. W., & Sandvik, L. (2009). The Wilcoxon-Mann-Whitney test under scrutiny. Statistics in Medicine, 28(10), 1487-1497. DOI: 10.1002/sim.3561
Read this for how differences in shape affect the large-sample p-value.
FREQUENTLY ASKED QUESTIONS
Menus, p-Values and Effect Size in the Example
Four questions are answered here. They deal with the SPSS screens, the method behind this analysis, the example in the video and how to report what it shows.
Why does the Two-Independent-Samples Tests dialog look different in my SPSS?
The video was recorded in an older release of IBM SPSS Statistics. Release 30 keeps 2 Independent Samples under Legacy Dialogs, with Define Groups and the four test types seen in the video. The Independent Samples entry higher in the same submenu is a separate procedure with its own output.
Should I report the asymptotic or the exact p-value?
Either one, named as such, because here both lead to the same reading (.173 and .186). The asymptotic value is adjusted for ties, and the Exact Sig. row is not, as its footnote says. With many ties or a close call, an exact value that corrects for ties comes from the Exact option, where your license includes it.
Which effect size fits the Mann-Whitney U of 53?
No effect size appears in the output. A direct one is the probability that a randomly chosen female score exceeds a male score, with ties counted as half, which is .66 from the sums of ranks (Divine et al., 2018). Another is r = .27 from Z and the 25 cases, taken in absolute value because SPSS signs Z by the smaller U and not by the group that scores higher.
How are mean ranks of 11.08 and 15.08 written with U = 53?
With each group’s n and mean rank, the test result and an effect size. Female participants (n = 12, mean rank 15.08) tended to score higher than male participants (n = 13, mean rank 11.08), but the test was not statistically significant, U = 53, Z = -1.36, asymptotic p = .173, exact p = .186, with an estimated probability of .66 that a female score exceeds a male score.
NEXT STEP
Need Two Groups Compared by Ranks,
Run or Checked?
OnlineSPSS is a statistical consultancy for researchers. Share your design and dataset, and a statistically trained Research Coordinator reviews it. The scope and one fixed project fee are confirmed before work begins.
No Commitment Required
Strictly Confidential
Fixed Project Fee
In-House PhD-Level Statisticians
Same-Day Response
Serving Researchers Since 2014