
Home / Resources / Psychological Measures / LOT-R
LOT-R:
Scoring and Interpretation
The Life Orientation Test-Revised (LOT-R) is a brief self-report measure of dispositional optimism, the tendency to expect favorable rather than unfavorable outcomes. LOT-R scoring looks simple but has two traps, four filler items that must stay out and three items that must be reversed, so this guide walks through the item key, the 0 to 24 total, SPSS and R code, and a model paragraph for your methods section.
What the LOT-R Measures
Scheier, Carver and Bridges (1994) revised the original Life Orientation Test so that optimism could be separated from closely related traits such as neuroticism, trait anxiety, self-mastery and self-esteem. The result is a short measure of generalized expectations about the future, not a measure of mood or a clinical screen.
Ten statements are administered, but only six contribute to the score. Four are fillers, and three of the six keyed items are worded pessimistically. Scoring all ten, or skipping the reversal, changes what the number means. Optimism and pessimism items are sometimes examined separately in research, but the standard score is the single six-item total.
Structure of the LOT-R
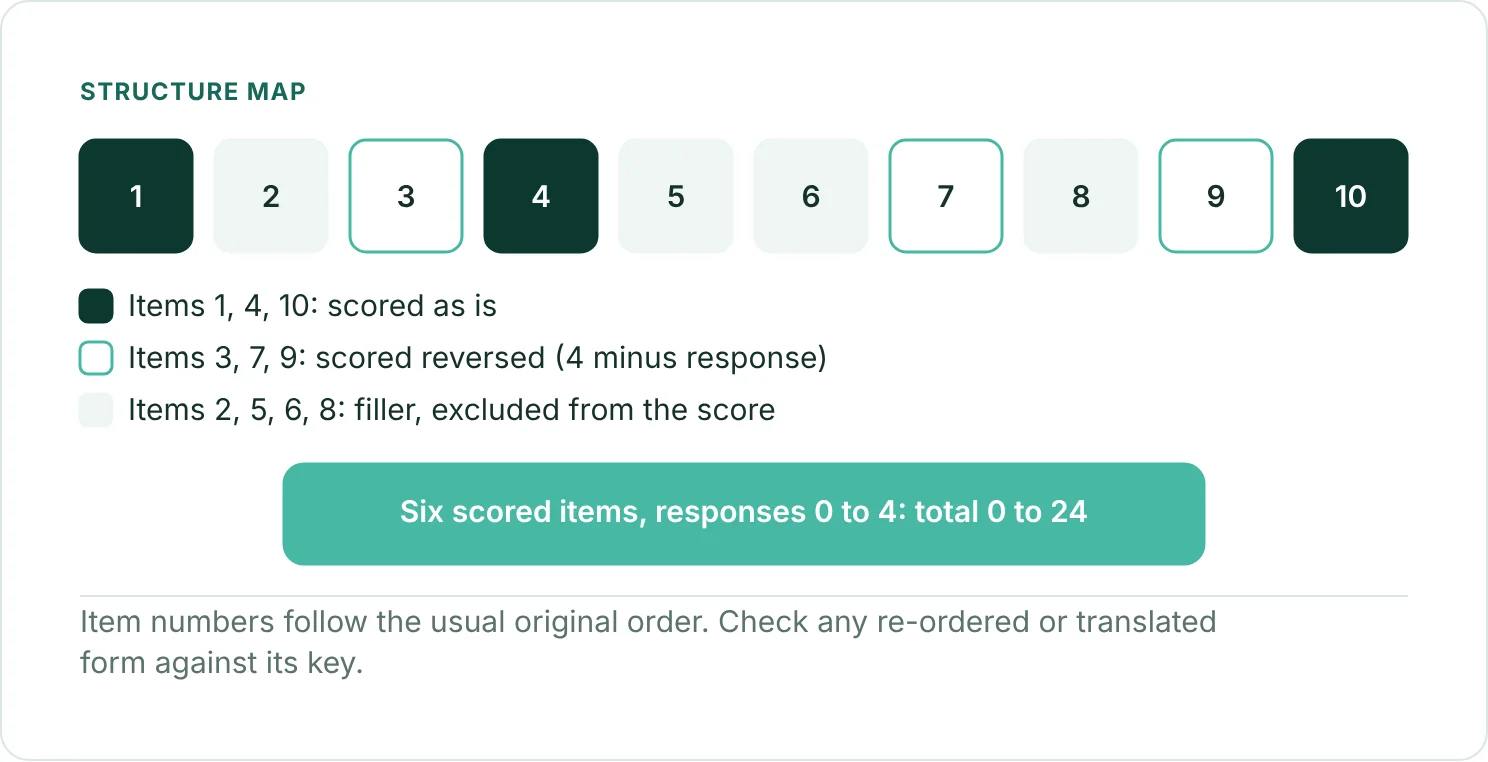
- Items: ten statements, of which six are scored and four are fillers.
- Keying: in the usual original item order, items 1, 4 and 10 are scored as is, items 3, 7 and 9 are reversed, and items 2, 5, 6 and 8 are excluded as fillers.
- Response scale: five agreement choices coded 0 to 4, from strongly disagree to strongly agree.
- Subscales: none standard. The three optimistic and three pessimistic items are sometimes analyzed as two poles, which needs a stated reason.
- Direction: after reversal, higher scores mean greater dispositional optimism.
- Versions and translations: the LOT-R is distinct from the original LOT. A re-ordered or translated form must be checked against its own item key before any code is run.
The items and their development are described in Scheier et al. (1994). Use the item order of the form you actually administered.
How to Score the LOT-R
- Confirm the item order of your form and that responses are coded 0 (strongly disagree) to 4 (strongly agree).
- Leave out the filler items 2, 5, 6 and 8.
- Reverse items 3, 7 and 9 by subtracting each response from 4.
- Sum items 1, 3 reversed, 4, 7 reversed, 9 reversed and 10 to obtain lotr_total, which ranges from 0 to 24.
- Keep the total missing when any of the six keyed items is missing, unless the protocol specifies another rule. No developer-endorsed prorating rule was verified, so any alternative must be prespecified and reported.
* Illustrative syntax: original LOT-R item order, responses coded 0 to 4.
COMPUTE lot3r = 4 - lot3.
COMPUTE lot7r = 4 - lot7.
COMPUTE lot9r = 4 - lot9.
COMPUTE lotr_total = SUM.6(lot1, lot3r, lot4, lot7r, lot9r, lot10).
EXECUTE.# data: one row per respondent; items lot1 to lot10 in original order, coded 0 to 4.
scored <- c("lot1", "lot3", "lot4", "lot7", "lot9", "lot10")
stopifnot(all(vapply(data[scored], function(z) all(is.na(z) | z %in% 0:4), logical(1))))
data$lotr_total <- ifelse(complete.cases(data[scored]),
data$lot1 + (4 - data$lot3) + data$lot4 + (4 - data$lot7) + (4 - data$lot9) + data$lot10,
NA_real_)Interpreting LOT-R Scores
| Score band | Interpretation |
|---|---|
| 0 to 24 | Continuous dispositional optimism; higher = more optimistic expectations |
| Severity or risk bands | None established for this instrument |
| Clinical cutoff | None established |
Source: Scheier et al. (1994); no clinical cutoff was verified.
Higher totals reflect greater dispositional optimism on the six scored items, and the 0 to 24 bounds describe the possible arithmetic range, not risk strata. A low score is not evidence of depression or any other disorder. If a study compares optimism and pessimism separately, it should state and justify that departure from the single total.
These are research measurement scores, not individual clinical judgments. Interpret group differences and change within the study design, with confidence intervals, and do not read a simple association as a causal effect of optimism.
Psychometric Properties
| Property | Published finding | Source |
|---|---|---|
| Original development | Optimism was examined alongside related personality constructs to show it is distinguishable from them | Scheier et al. (1994) |
| Scoring structure | Six content items and four fillers, with three negatively keyed content items | Scheier et al. (1994) |
| Construct context | A review discusses links between optimism, stress and well-being | Carver et al. (2010) |
| Reliability | Varies by sample and language; estimate it in your own data | Study-specific |
These are source-specific findings and cannot be assumed to hold as reliability or validity estimates in a new sample or language.
Using the LOT-R in a Study
The LOT-R is most often a continuous predictor of coping, health or well-being outcomes. Prespecify the covariates, and avoid presenting a cross-sectional association as an effect of optimism, since mood and recent events can influence responses. Check floor and ceiling behavior in the bounded 0 to 24 total, and where the outcome is measured later than the LOT-R, say so, because temporal order strengthens interpretation without establishing causation.
Estimate internal consistency for the six keyed items in your own sample and not for all ten, because fillers are not part of the score. If you analyze optimism and pessimism as separate poles, justify the two-factor representation with factor evidence from your data, and consider invariance testing before comparing groups or languages.
Reporting the LOT-R
Dispositional optimism was measured with the Life Orientation Test-Revised (LOT-R; Scheier et al., 1994). Six items contributed to the total after items 3, 7 and 9 were reversed, and four filler items were excluded. Responses were coded 0 to 4, giving a total score ranging from 0 to 24, with higher scores indicating greater optimism. Missing responses were handled by [method]. Internal consistency in the present sample was [coefficient and value].
References
Carver, C. S., Scheier, M. F., & Segerstrom, S. C. (2010). Optimism. Clinical Psychology Review, 30(7), 879-889. https://doi.org/10.1016/j.cpr.2010.01.006
Scheier, M. F., Carver, C. S., & Bridges, M. W. (1994). Distinguishing optimism from neuroticism (and trait anxiety, self-mastery, and self-esteem): A reevaluation of the Life Orientation Test. Journal of Personality and Social Psychology, 67(6), 1063-1078. https://doi.org/10.1037/0022-3514.67.6.1063
Frequently Asked Questions
How many LOT-R items count toward the score?
Six of the ten administered items are scored. The other four are fillers and are left out of the total.
Which LOT-R items are reversed?
In the usual original order, items 3, 7 and 9 are reversed (4 minus the response on the 0 to 4 coding). Check any re-ordered or translated form against its own key.
Are optimism and pessimism separate LOT-R subscales?
They can be examined separately in research, but the standard score is the six-item total, so a two-pole model needs its own justification.
Is there a LOT-R cutoff for low optimism?
No. The 0 to 24 range is a continuous score, and no clinical cutoff has been established.
NEXT STEP
Need LOT-R Data Scored
or Checked?
OnlineSPSS is a statistical consultancy for researchers. Share your design and dataset, and a statistically trained Research Coordinator reviews it. The scope and one fixed project fee are confirmed before work begins.
No Commitment Required
Strictly Confidential
Fixed Project Fee
In-House PhD-Level Statisticians
Same-Day Response
Serving Researchers Since 2014