
Home / Resources / Psychological Measures / BPAQ
Buss-Perry Aggression Questionnaire:
Scoring and Interpretation
The Buss-Perry Aggression Questionnaire (BPAQ) is a 29-item self-report measure of four aggression-related traits, rated from 1 to 5. Buss Perry Aggression Questionnaire scoring is easy to get wrong because the two reverse-keyed items sit at different positions in different layouts of the form. That detail shapes the approach here, which builds the key from the administered form first and then adds code, interpretation limits and reporting text.
What the BPAQ Measures
Buss and Perry (1992) constructed the questionnaire and, using replicated factor analyses, obtained four scales: Physical Aggression, Verbal Aggression, Anger and Hostility. They described anger as the bridge between physical and verbal aggression and hostility, so the four scores are related to one another and should not be treated as independent measures.
The questionnaire records what people say about their own tendencies, so it is not an observation of violent behavior and not an assessment of imminent risk. Researchers use it in personality, behavioral and intervention studies, where the practical issues are which layout of the form was administered, whether the factor structure holds in the sample, and whether group comparisons rest on measurement that is equivalent across groups and languages.
Structure of the BPAQ
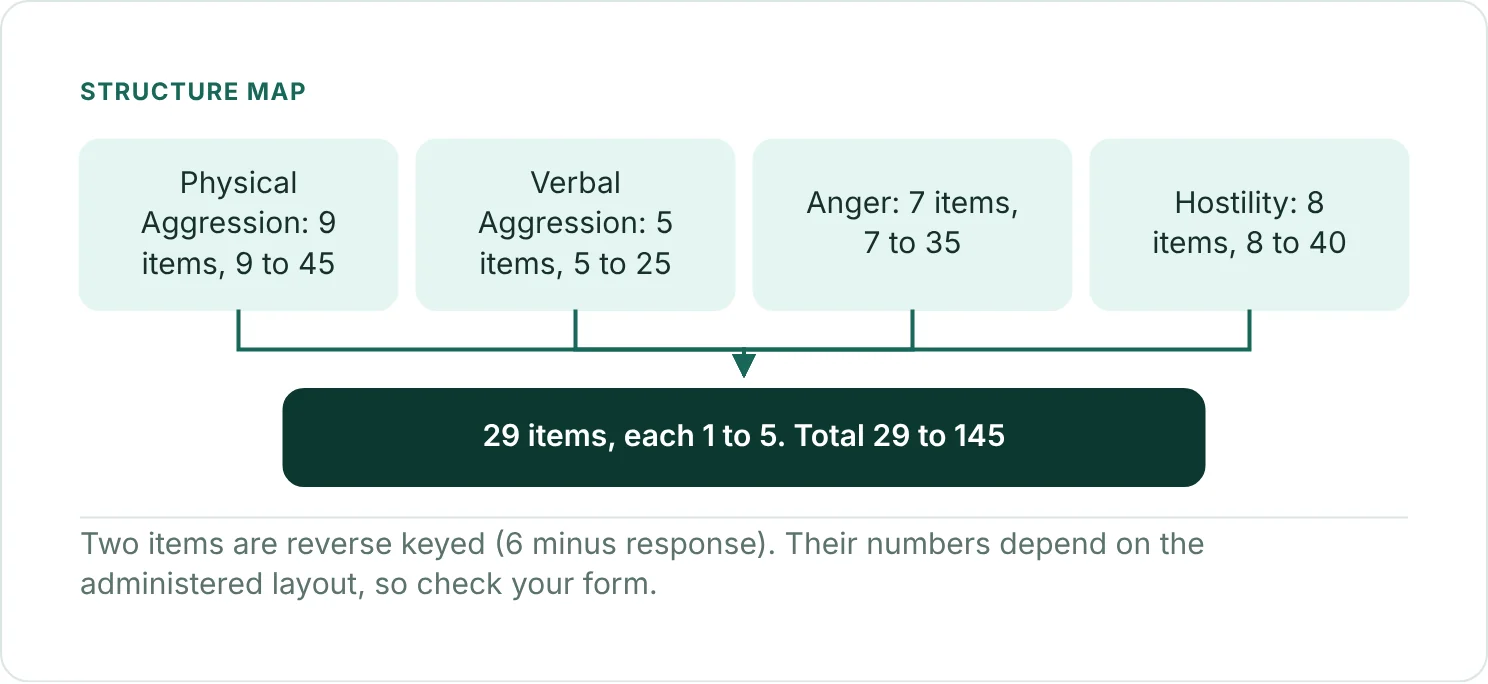
- Items: twenty-nine statements rated from 1 (extremely uncharacteristic) to 5 (extremely characteristic).
- Subscales: Physical Aggression (9 items), Verbal Aggression (5), Anger (7) and Hostility (8). Their sums run from 9 to 45, 5 to 25, 7 to 35 and 8 to 40.
- Direction: two items are reverse keyed and are scored as 6 minus the response. Their numbers depend on how the form is laid out, because some versions group items by subscale and others interleave them. Read the key from the form you administered, and do not carry item numbers over from another layout.
- Total: the sum of all 29 keyed items, from 29 to 145. Higher scores mean more self-reported aggression-related tendencies.
- Versions: alternate item orders and short forms exist, and each needs its own key and score range.
- Translations: name the language version and cite validation evidence for it.
Buss and Perry (1992) report the instrument. The item order and keying you need are those of the form actually administered, so record which layout your survey platform used.
How to Score the BPAQ
- Identify the layout of the administered form and write a key table with one row per item: its position, its subscale and whether it is reverse keyed.
- Check that bpaq1 to bpaq29 are integers from 1 to 5, then reverse the two reverse-keyed items by subtracting each response from 6.
- Sum the keyed items within each subscale, and sum all 29 for the total. The ranges are 9 to 45, 5 to 25, 7 to 35, 8 to 40 and 29 to 145.
- Apply a missing-item rule set by the protocol. No developer-endorsed prorating rule was verified, so the code below requires every item of a score. Report how incomplete responses were handled.
- Keep the raw responses and create the derived scores as new variables, so that the original answers are never overwritten.
* Illustrative syntax: the two reverse-keyed items are already recoded (6 minus response) and every keyed item is copied into its subscale set from your key table.
* Sets: bpaq_p1 to bpaq_p9 (Physical), bpaq_v1 to bpaq_v5 (Verbal), bpaq_a1 to bpaq_a7 (Anger), bpaq_h1 to bpaq_h8 (Hostility).
COMPUTE bpaq_physical = SUM.9(bpaq_p1 TO bpaq_p9).
COMPUTE bpaq_verbal = SUM.5(bpaq_v1 TO bpaq_v5).
COMPUTE bpaq_anger = SUM.7(bpaq_a1 TO bpaq_a7).
COMPUTE bpaq_hostility = SUM.8(bpaq_h1 TO bpaq_h8).
COMPUTE bpaq_total = SUM.4(bpaq_physical, bpaq_verbal, bpaq_anger, bpaq_hostility).
EXECUTE.# data: one row per respondent; items bpaq1 to bpaq29 coded 1 to 5 in the administered order.
# Fill in from the administered form: the two reverse-keyed item numbers and the item numbers of each subscale.
rev_items <- c()
keys <- list(physical = c(), verbal = c(), anger = c(), hostility = c())
stopifnot(length(rev_items) == 2,
identical(lengths(keys), c(physical = 9L, verbal = 5L, anger = 7L, hostility = 8L)),
setequal(unlist(keys), 1:29))
x <- data[paste0("bpaq", 1:29)]
stopifnot(all(vapply(x, function(z) all(is.na(z) | z %in% 1:5), logical(1))))
x[rev_items] <- lapply(x[rev_items], function(z) (6-z))
score <- function(k) ifelse(complete.cases(x[k]), rowSums(x[k]), NA_real_)
for (nm in names(keys)) data[[paste0("bpaq_", nm)]] <- score(keys[[nm]])
data$bpaq_total <- score(1:29)Interpreting BPAQ Scores
| Score | Interpretation |
|---|---|
| Subscale sums (9 to 45, 5 to 25, 7 to 35, 8 to 40) | Continuous; higher means more self-reported physical aggression, verbal aggression, anger or hostility |
| Total (29 to 145) | Overall level of self-reported aggression-related tendencies on the original metric |
| Cutoffs | None universal; use one only if it was validated for your population and version |
Source: Buss and Perry (1992); Bernstein and Gesn (1997). No universal threshold was verified.
A higher score indicates stronger self-reported tendencies. In the original samples, men scored higher on Physical Aggression by a wide margin and slightly higher on Verbal Aggression and Hostility, and the sexes did not differ on Anger (Buss & Perry, 1992). Such group differences describe those samples. They are not norms, and they are not a reason to assume that the groups are measured equivalently elsewhere.
A BPAQ score is not a risk determination or a diagnosis. Do not use a subscale or total score to label an individual as violent, and interpret results only for the version, layout and population in which the measurement was evaluated.
Psychometric Properties
| Property | Published finding | Source |
|---|---|---|
| Development | Replicated factor analyses yielded four scales | Buss & Perry (1992) |
| Reliability | The scales showed internal consistency and stability over time; estimate both for your own design | Buss & Perry (1992) |
| External correlates | Scale scores correlated with peer nominations of the different kinds of aggression | Buss & Perry (1992) |
| Dimensionality | The scales are intercorrelated to the point that they may not span four dimensions, although the multivariate structure was not an artifact of item distributions | Bernstein & Gesn (1997) |
These are source-specific findings and cannot be assumed to hold as reliability or structural estimates in a new sample, language or layout.
Using the BPAQ in a Study
Decide in advance whether the analysis targets the total, the four subscales or both. Because the subscales are correlated, model them jointly, for example in a multivariate model or a latent variable model, and not as unrelated outcomes. Evaluate reliability for each score you analyze, with a coefficient suited to five ordered categories, and test the structure in your sample before treating the four scores as established. Before comparing groups, sexes or language versions, check measurement invariance.
Treat regression results as associations, not as proof that a score predicts violent acts. Plan sample size from the primary hypothesis and the precision needed, and not from a minimum per item. Report the layout administered, the keying, the missing-data method and confidence intervals. For repeated measures or clustered data, use a model that respects the dependence, such as a mixed-effects model.
Reporting the BPAQ
Aggression was measured with the 29-item Buss-Perry Aggression Questionnaire (BPAQ; Buss & Perry, 1992) in the [layout and language] version. Items were rated from 1 to 5, two reverse-keyed items were recoded, and responses were summed to four subscale scores and a total (range = 29 to 145), with higher scores indicating greater self-reported aggression. Missing responses were handled by [method]. Internal consistency in the present sample was [alpha or omega = XX, 95% CI XX to XX] for [score], and the analyses used [score] as [outcome or predictor] in [model].
References
Bernstein, I. H., & Gesn, P. R. (1997). On the dimensionality of the Buss/Perry Aggression Questionnaire. Behaviour Research and Therapy, 35(6), 563-568. https://doi.org/10.1016/s0005-7967(97)00014-4
Buss, A. H., & Perry, M. (1992). The Aggression Questionnaire. Journal of Personality and Social Psychology, 63(3), 452-459. https://doi.org/10.1037/0022-3514.63.3.452
Frequently Asked Questions
Which BPAQ items are reverse keyed?
Two items are, but their numbers depend on the layout of the administered form. Build the key from your own form and do not borrow numbers from another version.
What is the range of the BPAQ total?
From 29 to 145 once all 29 items are keyed and answered, with subscale ranges of 9 to 45, 5 to 25, 7 to 35 and 8 to 40.
Does a high score confirm a diagnosis or predict violence?
No. It is a self-report trait score, and it is not a risk assessment.
Can I use the total instead of the four subscales?
Yes, if the hypothesis concerns overall self-reported aggression. State the choice in advance and report reliability for the score you analyze.
NEXT STEP
Need BPAQ Scores Set Up
or Checked?
OnlineSPSS is a statistical consultancy for researchers. Share your design and dataset, and a statistically trained Research Coordinator reviews it. The scope and one fixed project fee are confirmed before work begins.
No Commitment Required
Strictly Confidential
Fixed Project Fee
In-House PhD-Level Statisticians
Same-Day Response
Serving Researchers Since 2014