
Pearson Correlation in SPSS
Video Walkthrough of a Worked Matrix Example
This Pearson correlation in SPSS video relates a math test score to anxiety and stress ratings for 37 cases in one Bivariate Correlations run. The page adds what r can and cannot summarize, how three pairs are read and how the interval for .482 is built.
WATCH THE VIDEO
Pearson Correlation in SPSS, Start to Finish
Read the size of r and its interval before the p-value. Here r = .482 for Anxiety with Stress shares about 23% of the variance in the sample (the square of the printed value), and p = .003 gives evidence against a population correlation of zero. The other two pairs, .233 and -.279, have p above .05, which is not evidence that the scores are unrelated.
IN SHORT
What the Video Shows in Brief
In this Pearson correlation in SPSS video, MathTestScore (1 to 100), Anxiety (1 to 5) and Stress (1 to 10) of 37 cases are correlated in pairs in the Bivariate Correlations dialog. The path is Analyze, Correlate, Bivariate. Anxiety with Stress gives r = .482, two-tailed p = .003, N = 37, which is statistically significant. The two pairs with the math score give r = .233 (p = .165) and r = -.279 (p = .094), neither statistically significant.
BEFORE YOU RUN
Scales, Linearity and Extremes Before Bivariate
These four points cover what to check in your study design and data, and each one is settled before the analysis is run in SPSS.
Quantitative Scales MathTestScore runs from 1 to 100, Anxiety takes five values and Stress ten. Pearson's r treats each step of a rating as equal, and 12 of 37 Anxiety ratings sit at 5, so a rank-based coefficient is the alternative when that is doubtful.
A Straight-Line Pattern Pearson's r summarizes a linear pattern only. Very different scatterplots can give the same r (Anscombe, 1973), and the video draws none. MathTestScore has no value between 70 and 80, which a plot of each pair would show.
Extreme Cases and Shape The p-value and the interval assume roughly bivariate normal data. More pairs protect the p-value, but heavy tails distort the interval at any N, and one isolated pair can move r a long way.
Unrelated Cases Each row is a separate case with one score on every variable. Cases from one classroom, or the same person measured twice, share influences, so the p-value and interval would look more precise than the data justify.
STEP BY STEP
Running Three Pearson Correlations in One Dialog
The screenshots show each screen in IBM SPSS, and the numbered steps below give the menu path, the settings to choose and a check or tip for each step.
The slides follow the step numbers, each one showing the SPSS screen for that step. The video was made in an older release, so some labels on your screen may differ.
Open the Bivariate Correlations Dialog
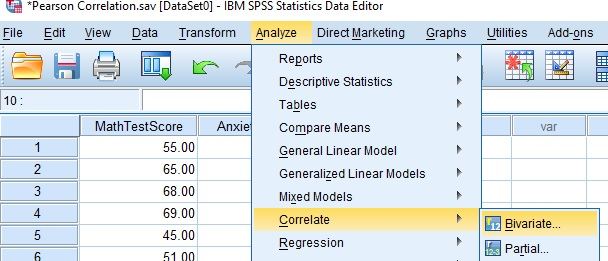
Choose Analyze, then Correlate, then Bivariate. Under the open menu, the Data Editor lists one case per row, with MathTestScore values of 55, 65 and 68 first.
Check: Partial sits directly under Bivariate in the submenu. A coefficient between two variables with nothing else controlled is made in Bivariate, and Partial first removes the linear effect of a third variable.
Select MathTestScore, Anxiety and Stress
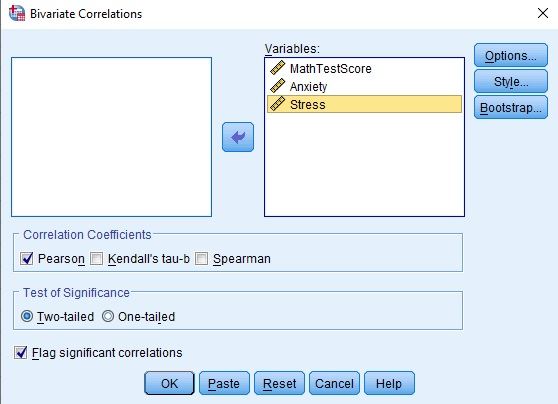
Select all three names in the left-hand list and carry them across to the Variables box using the arrow button. Three variables give three pairs, and the dialog shows each one with the scale (ruler) icon.
Watch: Every added variable multiplies the pairs, so ten variables would mean 45 correlations. List only the variables whose pairs the analysis plan names, and treat the p-values of the rest as exploratory.
Leave Pearson and Two-Tailed Ticked
Under Correlation Coefficients, Pearson is already ticked, with Kendall’s tau-b and Spearman clear. Keep Test of Significance on Two-tailed and Flag significant correlations ticked, then select OK. The picture of step 2 also shows these ticks.
Tip: One-tailed would halve each p but suits only a direction stated before the data were seen. Without that, Two-tailed is the setting, and the table heading Sig. (2-tailed) confirms it.
Check the CORRELATIONS Command in the Log
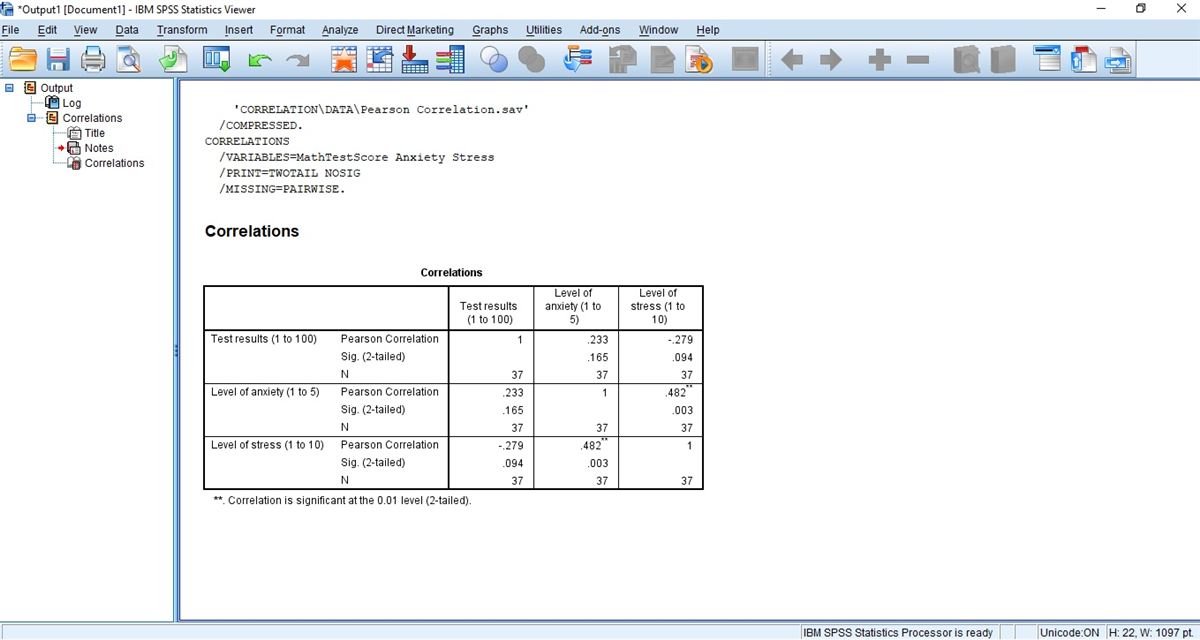
The Log, the first entry in the Viewer outline, lists the CORRELATIONS command with /VARIABLES=MathTestScore Anxiety Stress, /PRINT=TWOTAIL NOSIG and /MISSING=PAIRWISE. Title, Notes and the Correlations table follow.
Watch: PAIRWISE exclusion gives each pair the cases that have both values. All three pairs show N = 37, so nothing was dropped here, but gaps in the data would give each coefficient its own N.
Read the Correlations Table
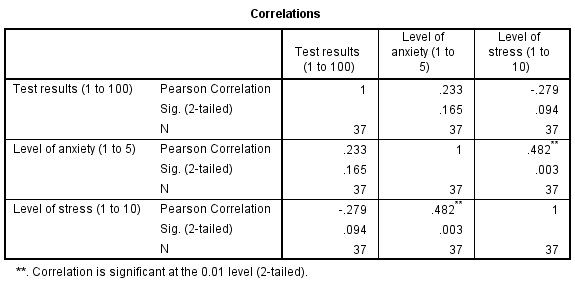
Each block gives Pearson Correlation, Sig. (2-tailed) and N. Anxiety with Stress reads .482, .003 and 37, MathTestScore with Anxiety reads .233, .165 and 37, and MathTestScore with Stress reads -.279, .094 and 37.
Tip: The footnote Correlation is significant at the 0.01 level (2-tailed) explains the two asterisks on .482. The other four off-diagonal cells carry none, which says only that their p-values are above .05.
READING THE OUTPUT
Reading the Correlations Table and Its Asterisks
Read the table one row at a time: a value from the SPSS output, the figure it takes in the video example, and how to read the same value in your data.
| Output value | In the example | How to read it |
|---|---|---|
| Pearson Correlation (off-diagonal) | .233, -.279 and .482 | Pearson’s r for each pair, the direction and size of a linear pattern in the sample. Quote the signed value |
| Pearson Correlation (diagonal) | 1 for each variable | Each variable correlated with itself, so always 1. It is not a result |
| Sig. (2-tailed) | .165, .094 and .003 | Two-sided p for a population correlation of zero. Only .003 is below .05, and none of the three measures strength |
| N | 37 in every cell | Cases with both values for that pair. SPSS prints no df |
| Strength labels | .482 as the largest value | Cut-offs for small, medium and large vary by field and textbook, so give the signed value and its interval before any label |
| Asterisks | Two, on .482 | Flag significant correlations marks p below .01 with two and below .05 with one. It is a flag, not a size |
| Repeated blocks | .233, .165 and 37 occur twice | Each pair sits above and below the diagonal, so the triangle under it mirrors the one above. Read each pair once |
| Missing from this output | No descriptive statistics, plot or interval | Nothing beyond the table was requested, so the intervals in the FAQ are calculated outside SPSS |
COMMON MISTAKES
Slips With Extra Coefficients, Printed df and Verdicts on r
These six mistakes arise in the data setup, the SPSS dialogs, the output or the write-up, and each comes with a short note on how to avoid it.
The N Written as df SPSS prints N = 37 and no df. In r(37) = .482 the 37 is the case count, while a correlation from 37 pairs has N minus 2, or 35, degrees of freedom, so the notation is r(35) = .482.
A p of .000 Written Out SPSS shows three decimals, so a tiny p is printed as .000. This table prints .003 for Anxiety with Stress, which is quoted as p = .003, and a printed .000 is written p < .001 because no p-value is exactly zero.
A Zero for a Skipped Test A participant who skipped the test and was entered as 0 becomes an extreme point on MathTestScore and pulls every coefficient that involves it. Define a missing-value code under Variable View and compare N with the complete cases.
Several Coefficients Ticked Ticking Kendall's tau-b or Spearman beside Pearson prints more coefficients for the same pairs. Choosing the one that looks best after the run lets the data pick the statistic, so name the coefficient in the analysis plan.
Labels Matched to the Wrong Rows The dialog lists MathTestScore, Anxiety and Stress, but the Correlations table uses the labels Test results (1 to 100), Level of anxiety (1 to 5) and Level of stress (1 to 10). Match each row to its variable before copying.
Influence Assumed From r A correlation is symmetric: .482 is the same whichever variable is named first. It cannot say that anxiety raises stress, and wording such as anxiety causes stress goes beyond what the coefficient shows.
If you have already run this test, Independent Statistical Review has an OnlineSPSS statistician check the pairs, the df and the wording against your output.
SOURCES
Sources and Further Reading
Every entry below supports a point made on this page. Read the short line beneath it to see what it is worth reading for.
Anscombe, F. J. (1973). Graphs in statistical analysis. The American Statistician, 27(1), 17-21. DOI: 10.1080/00031305.1973.10478966
Read this for why a plot comes before any correlation is quoted.
Bonett, D. G., & Wright, T. A. (2000). Sample size requirements for estimating Pearson, Kendall and Spearman correlations. Psychometrika, 65(1), 23-28. DOI: 10.1007/BF02294183
Read this for interval estimates of Pearson's r and their width.
FREQUENTLY ASKED QUESTIONS
Menus, Intervals and Ranks in the Example
These answers explain why the SPSS screens may look different from the video, then take up the method, the example figures and how to write the result up.
Why does the Bivariate Correlations dialog look different in my SPSS?
The video was recorded in an older release of IBM SPSS Statistics. IBM’s blog for release 27.0.1.0 describes a Confidence Intervals sub-dialog in Bivariate Correlations. It offers a confidence level and, for Pearson’s coefficient, an optional bias adjustment. The video’s dialog shows no such button, and its Correlations table prints no interval.
What interval goes with r = .482 and N = 37?
The output prints none. The Fisher z transformation (Bonett & Wright, 2000), applied outside SPSS, gives a 95% interval from about .19 to .70 for Anxiety with Stress. For the math score it is about -.10 to .52 with Anxiety and about -.55 to .05 with Stress, so both of those include zero.
Does ranking the five Anxiety levels change r = .482?
Pearson’s r takes each step of a rating as equal, which a rank-based coefficient does not. Computed outside SPSS on the data file, Spearman’s rho for Anxiety with Stress is about .51, close to .482, so the choice of coefficient leaves the picture unchanged here. Choose it from the scales and the pattern, not from the result.
How are r = .482, p = .003 and N = 37 written up?
Name the pair, the sign, the size, the df and the uncertainty. Anxiety and stress were positively correlated, r(35) = .482, p = .003, 95% CI [.19, .70] (interval calculated outside SPSS). The two pairs with the math score are reported in the same form, each with its own interval, not as p-values alone.
NEXT STEP
Need a Correlation Matrix
Run or Checked?
OnlineSPSS is a statistical consultancy for researchers. Share your design and dataset, and a statistically trained Research Coordinator reviews it. The scope and one fixed project fee are confirmed before work begins.
No Commitment Required
Strictly Confidential
Fixed Project Fee
In-House PhD-Level Statisticians
Same-Day Response
Serving Researchers Since 2014