
Spearman's Rank Correlation in SPSS
Video Walkthrough of a Worked Rho Example
This Spearman's rank correlation in SPSS video examines whether the English marks and stress ratings of 24 cases rise and fall together in rank. The page adds what rho measures, how the sign and the ties are read, and why the p-value cannot stand alone.
WATCH THE VIDEO
Spearman's Rank Correlation in SPSS, Start to Finish
Report the sign and size of rho with an interval, not only the p-value. Here rho is +.218 for 24 cases, a weak positive monotonic association in the sample, and p = .306 gives no evidence of one in the population, which differs from showing that there is none. An interval shows how wide the range of compatible values is, and the sign in the table decides the direction of the sentence.
IN SHORT
What the Video Shows in Brief
In this Spearman’s rank correlation in SPSS video, English marks (1 to 5) and stress ratings (1 to 10) of 24 cases are correlated in the Bivariate Correlations dialog with only Spearman ticked. The path is Analyze, Correlate, Bivariate. Spearman’s rho is .218, two-tailed p = .306, N = 24: a weak positive correlation in the sample that is not statistically significant.
BEFORE YOU RUN
Scale, Monotonic Shape and Ties Before Bivariate
Here are four points to settle about your study design and your data, each one ahead of running this Spearman correlation in SPSS.
An Ordered Scale An English mark from 1 to 5 and a stress rating from 1 to 10 are both ordered, which suits a rank-based coefficient. Spearman's rho measures monotonic association and suits ordinal data (Schober et al., 2018).
A Monotonic Pattern Rho picks up any steadily rising or falling pattern, but it can sit near zero for a U-shape or an inverted U despite a clear association. A scatterplot is the check, and the video does not draw one.
Ties Among 24 Cases The mark takes five values across 24 cases, with eight cases at 5 and six at 1, so many cases tie. Tied marks share an average rank, so rho could reach 1 only if the stress ranks matched them exactly, ties included.
Independent Pairs Each case contributes one pair, and the cases are unrelated to one another. Several pairs from one person, or cases sharing a classroom, break this, and the p-value then overstates what the data contain.
STEP BY STEP
Setting Up Bivariate Correlations for Spearman's Rho
Screens are pictured as they appear in IBM SPSS, and each numbered step below sets out the menu path, the settings to select and one check or tip.
Every slide pictures the SPSS screen for a single step and is numbered to match it. Labels in your version may differ a little, as the video comes from an older release.
Open the Bivariate Correlations Dialog
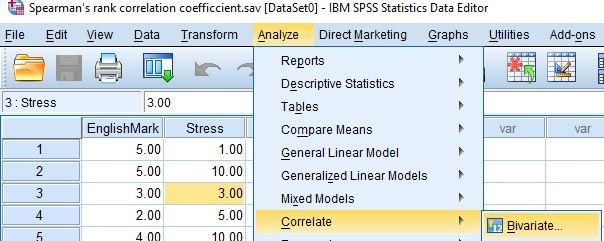
Choose Analyze, then Correlate, then Bivariate. The Data Editor behind the menu holds EnglishMark and Stress as two columns, with one row per case.
Check: The Correlate submenu also lists Partial and Distances. Two variables with nothing held constant belong in Bivariate, while a third variable held constant belongs in Partial.
Select EnglishMark and Stress as Variables
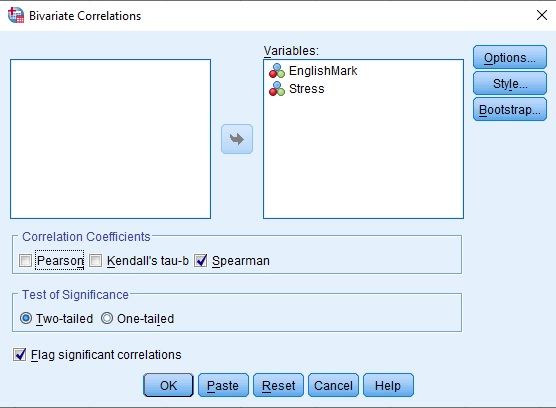
Select both variables in the list on the left and move them into the Variables box. The order does not change the coefficient, because the table is symmetric.
Watch: Both variables carry the Nominal icon in the dialog, although a mark and a rating are ordered. The measure label does not change rho, but the coding direction does set its sign.
Tick Spearman and Keep Two-Tailed
Under Correlation Coefficients, untick Pearson, which is on by default, and tick Spearman. Test of Significance stays Two-tailed and Flag significant correlations stays ticked, then select OK. The same dialog picture serves steps 2 and 3.
Tip: Flag significant correlations adds asterisks to coefficients with p below .05 or .01. They are flags only and say nothing about strength, and with p = .306 none appears here.
Check the NONPAR CORR Command in the Log
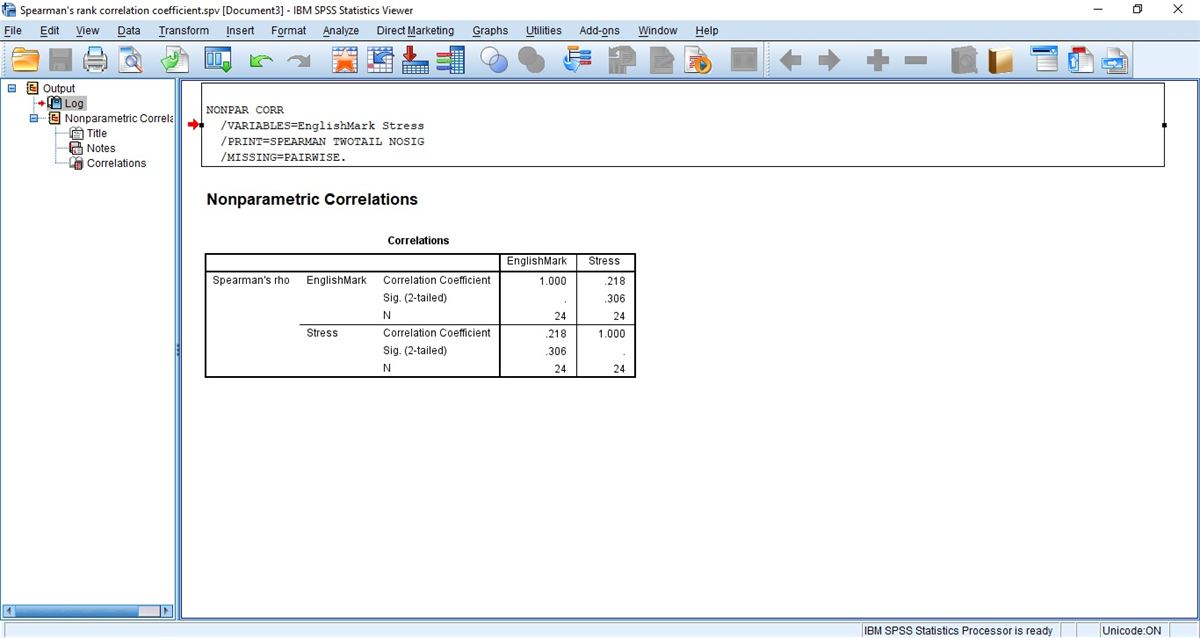
The Viewer opens with a Log that holds the NONPAR CORR command, with SPEARMAN, TWOTAIL and MISSING=PAIRWISE among its lines, then the Nonparametric Correlations heading with Title, Notes and Correlations.
Watch: Pairwise exclusion lets each coefficient use every case that has both of its variables. With two variables that is the same 24 cases, while a longer list can give every pair its own N.
Read the Correlations Table
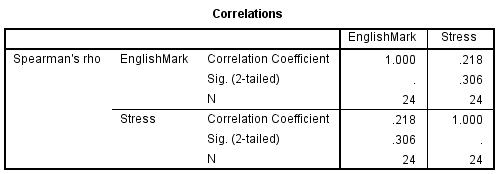
A 2 by 2 matrix gives Correlation Coefficient, Sig. (2-tailed) and N for each pair of variables. EnglishMark with Stress reads .218, .306 and 24, and the two diagonal cells read 1.000 for each variable with itself.
Tip: The Sig. (2-tailed) cells on the diagonal hold only a dot, because no test is run for a variable with itself. The off-diagonal .306 is the one p-value in the table.
READING THE OUTPUT
Reading the Nonparametric Correlations Table
The table picks out SPSS output values for this Spearman correlation, one per row, each with its video figure and a note on reading it in your data.
| Output value | In the example | How to read it |
|---|---|---|
| Correlation Coefficient (off-diagonal) | .218, EnglishMark with Stress | Spearman’s rho, the Pearson correlation of the two sets of ranks. Its sign and size are what the write-up reports |
| Size of rho | .218 | A weak monotonic association by common rules of thumb. The labels differ between sources, so quote the value |
| Correlation Coefficient (diagonal) | 1.000 for each variable | A variable with itself, always 1. It is not a finding |
| Sig. (2-tailed) | .306 | Two-sided p for a population rho of zero, from a t approximation that SPSS does not print. Above .05, so not statistically significant |
| N | 24 in every cell | Pairs with both values. The p-value uses N minus 2, or 22 |
| Repeated blocks | .218, .306 and 24 appear twice | The matrix is symmetric, so the lower block repeats the upper one. Read one block |
| Asterisks | None | Flag significant correlations is ticked, and no coefficient reaches p below .05 |
| Not in this output | No descriptives, scatterplot, df or interval | The four screenshots show none of them. A scatterplot is needed to judge the pattern |
COMMON MISTAKES
Slips With the Ticks, the Sign and the Wording of Rho
Here are six mistakes made with this Spearman correlation in the data, the dialogs, the output or the write-up, each with a short way to avoid it.
Pearson Left Ticked Beside Spearman Pearson is on by default. Leaving it ticked prints a second correlation table next to the Nonparametric Correlations one, and quoting the stronger one lets the result pick the coefficient.
The Sign Read Backwards A positive rho of .218 means higher marks go with higher stress ratings. Reading it as marks falling when stress rises reverses the direction, so check the sign and the coding of both scales before writing.
The df Quoted as N SPSS prints N = 24 and no df. Writing r(24) = .218 puts the case count where the df belong. With N minus 2 the notation is rs(22) = .218, or the N can be given beside rho.
A Missing Code Ranked as Data A stress rating stored as 99 for a skipped answer would be ranked as the highest stress of all. Declare such codes as missing in Variable View before the run, then compare N in the table with the number of complete pairs.
A Large p Read as No Relationship A p of .306 does not show that marks and stress are unrelated. With only 24 pairs, values from a weak negative rho to above .5 remain compatible with the data.
Direction of Influence Assumed Rho is symmetric, and the table repeats .218 in both blocks. It cannot say whether stress affects marks or the reverse, so wording such as stress lowers marks goes beyond a correlation.
If you have already run this test, Independent Statistical Review has an OnlineSPSS statistician check the sign, the ties and the wording against your output.
SOURCES
Sources and Further Reading
Each source listed here backs a statement on this page, and the line beneath it tells you what to read it for.
Schober, P., Boer, C., & Schwarte, L. A. (2018). Correlation coefficients: Appropriate use and interpretation. Anesthesia & Analgesia, 126(5), 1763-1768. DOI: 10.1213/ANE.0000000000002864
Read this for when Spearman's rho is used instead of Pearson's r.
Bonett, D. G., & Wright, T. A. (2000). Sample size requirements for estimating Pearson, Kendall and Spearman correlations. Psychometrika, 65(1), 23-28. DOI: 10.1007/BF02294183
Read this for a standard error and interval for Spearman's rho.
FREQUENTLY ASKED QUESTIONS
Menus, Intervals and Ties in the Example
Four questions on this Spearman correlation are answered here: an SPSS screen that differs from the video, the method, the example figures and the write-up.
Why does the Bivariate Correlations dialog look different in my SPSS?
The video was recorded in an older release of IBM SPSS Statistics. IBM’s release 27.0.1.0 added a Confidence Intervals sub-dialog to Bivariate Correlations, with a confidence level and a choice of method for coefficients other than Pearson’s. The video’s dialog has no such button, so its output carries no interval.
What interval goes with rho = .218 and N = 24?
The video’s output prints none. Computed outside SPSS with the Fisher z transformation and the standard error proposed for Spearman’s rho (Bonett & Wright, 2000), an approximate 95% interval runs from about -.21 to .57. Weak negative and moderate positive values are both compatible with the data, so p = .306 alone says little.
Do the many ties change rho or its p-value?
Rho is computed from average ranks, so the tied marks are handled and .218 stands. The printed p is a t-based approximation on 22 df, which is rougher with only five mark values among 24 cases. A permutation check on the data file gives about .30, close to the printed .306.
How are rho = .218, p = .306 and N = 24 written up?
Name the coefficient, the direction, the size and the uncertainty. English mark and stress rating were weakly and positively correlated, but not statistically significantly, rs(22) = .218, p = .306, 95% CI [-.21, .57], with the interval computed outside SPSS. The interval includes zero.
NEXT STEP
Need Ordinal Variables Correlated,
Run or Checked?
OnlineSPSS is a statistical consultancy for researchers. Share your design and dataset, and a statistically trained Research Coordinator reviews it. The scope and one fixed project fee are confirmed before work begins.
No Commitment Required
Strictly Confidential
Fixed Project Fee
In-House PhD-Level Statisticians
Same-Day Response
Serving Researchers Since 2014