
Wilcoxon Signed-Rank Test in SPSS
Video Walkthrough of a Worked Score Example
This Wilcoxon signed-rank test in SPSS video asks whether English scores of 21 participants changed after training. The page adds why the differences, not the two medians, carry the result, why Z is negative and which effect size fits.
WATCH THE VIDEO
Wilcoxon Signed-Rank Test in SPSS, Start to Finish
Treat the Wilcoxon signed-rank test as a test on the paired differences, not as a comparison of the two medians in the Descriptive Statistics table. It asks whether the changes are balanced around zero, so the summary to quote beside it is a summary of the changes. Here the medians are 62 and 80, yet the median of the 21 paired differences is 14, and the two figures answer different questions.
IN SHORT
What the Video Shows in Brief
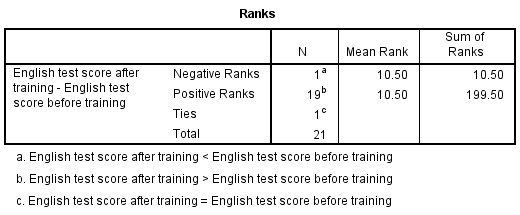
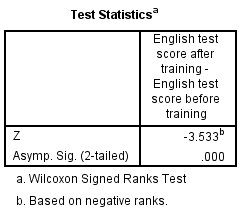
In this Wilcoxon signed-rank test in SPSS video, English test scores of 21 participants are compared before and after training. The path is Analyze, Nonparametric Tests, Legacy Dialogs, 2 Related Samples, with Wilcoxon ticked as the test type. One participant scored lower after training, 19 scored higher and 1 scored the same; Z = -3.533 and the asymptotic p is below .001, which is strong evidence against balanced changes.
BEFORE YOU RUN
Pairs, Zeros and Symmetry Before 2 Related Samples
The four points below concern your study design and your data. Settle each one first, then run the Wilcoxon test in SPSS.
Linked Measurements Each participant has a before score and an after score, and the design settles this, not a test. Different participants in two groups call for the Mann-Whitney U test, and the Friedman test fits three or more occasions.
Differences With a Size The test ranks how large each change is, so 20 points must mean more than 10. Scores suit that. A short rating with few levels may carry only a direction, and the sign test in the same dialog uses only that.
Shape of the Differences Plot the 21 after-minus-before differences, not the two score columns. Rough symmetry lets the result describe a shift in the typical change; with strong skew it says only that rises outweigh falls in number and size.
Zero Differences A participant whose score did not change gives a difference of zero and no direction. SPSS lists that pair under Ties and leaves it out, so 20 pairs are ranked, and procedures differ in how they treat zeros (Pratt, 1959).
STEP BY STEP
Pairing Two Scores in Two-Related-Samples Tests
Follow the numbered steps below through IBM SPSS, with screenshots as you go: each step gives the menu path, the settings to pick and a check or tip.
Each slide pairs with one step through its number and shows the SPSS screen at that point. Newer releases may word some labels slightly differently from the older one used in the video.
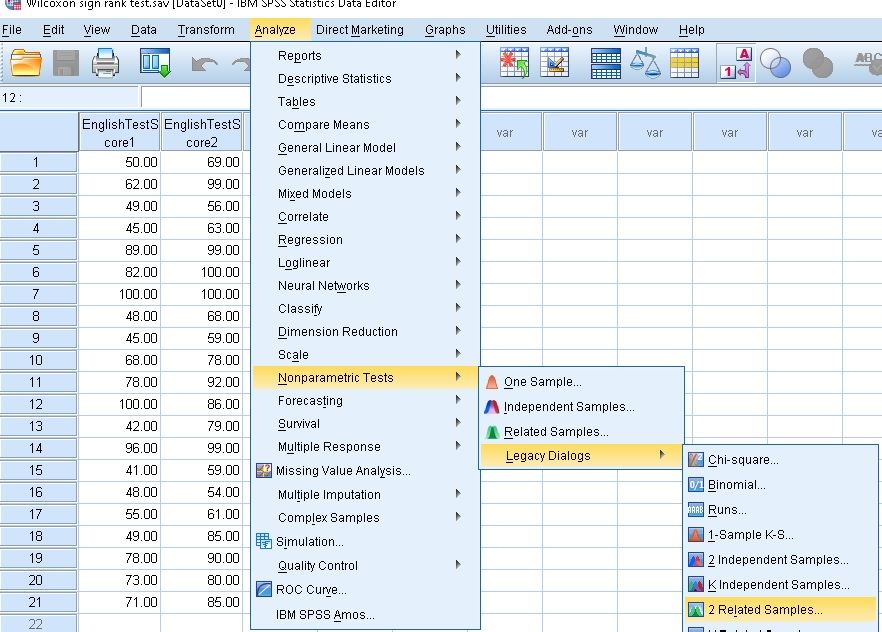

Open the 2 Related Samples Dialog
Choose Analyze, then Nonparametric Tests, then Legacy Dialogs, then 2 Related Samples. The dialog opens with the variable list on the left and an empty Test Pairs grid with Variable1 and Variable2 columns.
Check: The legacy list holds 2 Independent Samples, K Independent Samples and 2 Related Samples next to each other in one list. Two scores from the same participants belong to the last of them.
Pair the Scores and Choose Wilcoxon
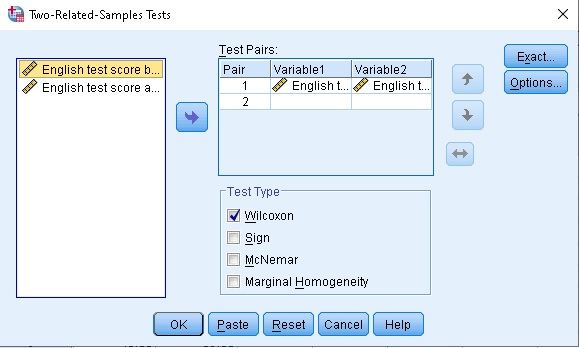
In the Two-Related-Samples Tests dialog, select the before score and then the after score and move them with the arrow into Test Pairs as Variable1 and Variable2. Under Test Type, Wilcoxon is ticked.
Watch: SPSS subtracts Variable1 from Variable2, so the order of selection sets the sign of every difference. With before first, a positive rank is a participant who scored higher after training.
Tick Descriptive and Quartiles in Options
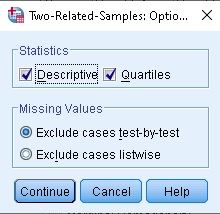
In Options, tick Descriptive and Quartiles under Statistics, keep the Missing Values setting at Exclude cases test-by-test, and confirm with Continue and OK.
Tip: Exclude cases test-by-test matters only when several pairs are listed; with one pair it and listwise give the same 21 cases.
Confirm 21 Pairs in the NPar Tests Output
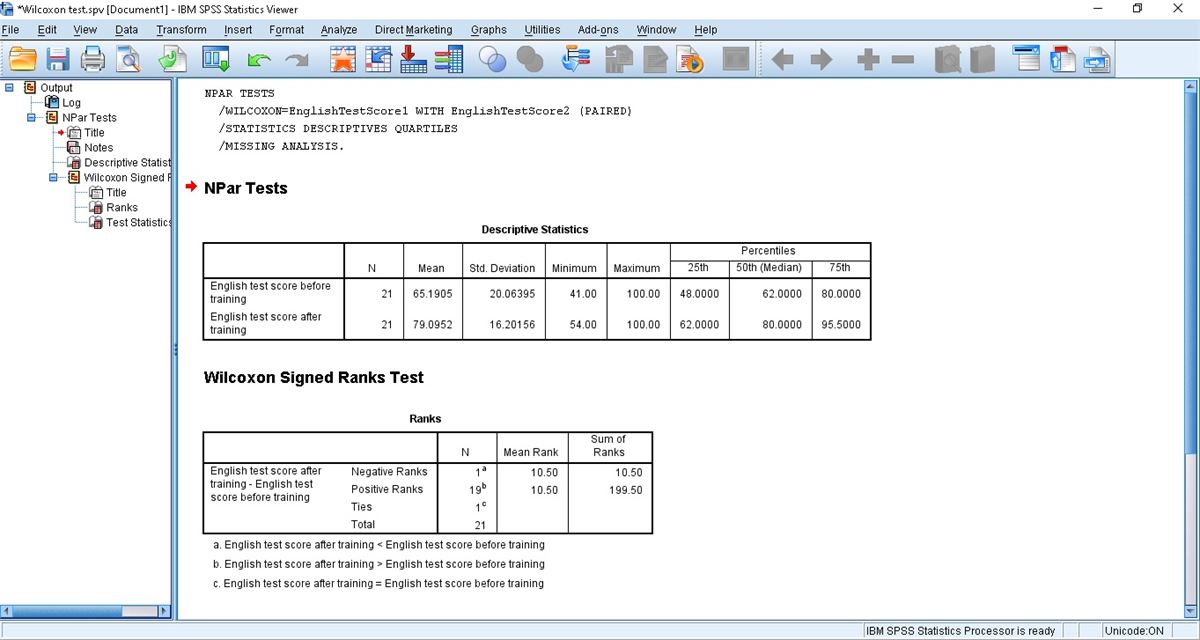
The Viewer shows the NPAR TESTS syntax, then NPar Tests with Descriptive Statistics, then the Wilcoxon Signed Ranks Test with its Ranks and Test Statistics tables. Read the N column first.
Check: Both scores should show N = 21, the number of participants. A smaller N means a missing score, and a pair with one score missing cannot enter the test.
Read the Signed Ranks Table
Ranks lists Negative Ranks (1), Positive Ranks (19) and Ties (1) for the 21 pairs, with the mean rank and the sum of ranks for each direction. The footnotes under the table define the three labels.
Watch: The ranks count pairs by direction and weight them by the size of the change. Both mean ranks are 10.50, so the sums, 10.50 against 199.50, show which side carries the weight.
Read Z and the Asymptotic p
Test Statistics gives Z = -3.533 and Asymp. Sig. (2-tailed) = .000. Footnote a names the Wilcoxon Signed Ranks Test, and footnote b states that Z is based on negative ranks.
Tip: The printed p is asymptotic, from a normal approximation to the ranks of 20 pairs. The Exact button in the dialog offers an exact p-value where your license includes it, and it is chosen before OK.
READING THE OUTPUT
Reading the Ranks Table and the Negative Z
The table picks out SPSS output values for the Wilcoxon test, one per row, each with its video figure and a note on reading it in your data.
| Output value | In the example | How to read it |
|---|---|---|
| N | 21 before, 21 after | Valid scores per occasion, counted column by column before any pairing |
| Mean and Std. Deviation | Before 65.19 (20.06), after 79.10 (16.20) | In score points, for each occasion. The test itself ranks the changes and does not use these means |
| Minimum and Maximum | Before 41 and 100, after 54 and 100 | The range of each score on its own, in score points |
| 25th, 50th (Median) and 75th percentiles | Before 48, 62, 80. After 62, 80, 95.5 | Quartiles of each score separately. The changes have quartiles of their own, which this table does not print |
| Negative Ranks, Positive Ranks, Ties | 1, 19 and 1, total 21 | Pairs with a lower, higher and equal after score. The footnotes spell out each label |
| Sum of Ranks | Negative 10.50, positive 199.50 | The ranks of the absolute changes add to 210 across the 20 ranked pairs |
| Z | -3.533 | The standardized statistic. Footnote b names the rank sum it is based on |
| Asymp. Sig. (2-tailed) | .000 | Two-sided p from the normal approximation, below .0005. The p-value carries no information on the size of the change |
COMMON MISTAKES
Slips With the Sign of Z and Ceiling Scores
These six mistakes arise in the data setup, the SPSS dialogs, the output or the write-up, and each comes with a short note on how to avoid it.
Z Read as the Direction of Change Z is -3.533 although 19 of 21 scores rose, because it is based on the negative ranks. The Ranks table gives the direction, and the sentence names it in words without quoting the sign of Z.
Training Named as the Cause With one group measured twice, the data cannot separate training from other changes over time, such as practice on the same test. Write that scores were higher after training, not that training raised them.
Ceiling Scores Left Unexamined Two participants scored 100 before training and could not rise. One of them is the tied pair and the other is the only participant whose score fell, so look at the pairs behind the Ranks table.
Missing Scores Typed as Zero A zero entered for a missing score is a real score to SPSS and creates a large false change. Declare a missing-value code in Variable View so that the pair leaves the test, as the N column then shows.
Two Occasions Stored in One Column Scores stacked in one column with an occasion code cannot be paired by 2 Related Samples. Restructure them into a before and an after column, one participant per row, as in the video's file.
Two Tests, One Reported Running the paired t-test after seeing the Wilcoxon result, and quoting whichever suits, makes the choice depend on the data. Name the main test in the analysis plan, and report any second test as a check.
If you have already run this test, Independent Statistical Review has an OnlineSPSS statistician check the pairing, the ties and the wording against your output.
SOURCES
Sources and Further Reading
Each source listed here backs a statement on this page, and the line beneath it tells you what to read it for.
Pratt, J. W. (1959). Remarks on zeros and ties in the Wilcoxon signed rank procedures. Journal of the American Statistical Association, 54(287), 655-667. DOI: 10.1080/01621459.1959.10501526
Read this for how zero differences are handled in signed-rank procedures.
Kerby, D. S. (2014). The simple difference formula: An approach to teaching nonparametric correlation. Comprehensive Psychology, 3, Article 11.IT.3.1. DOI: 10.2466/11.IT.3.1
Read this for the rank-biserial correlation as a matched-pairs effect size.
FREQUENTLY ASKED QUESTIONS
Menus, Test Choice and Effect Size in the Example
These answers explain why the SPSS screens may look different from the video, then take up the method, the example figures and how to write the result up.
Why does the Two-Related-Samples Tests dialog look different in my SPSS?
The video was recorded in an older release of IBM SPSS Statistics. In release 30 the path through Legacy Dialogs to 2 Related Samples is unchanged, and Wilcoxon, Sign and McNemar remain test types, with Marginal Homogeneity tied to the Exact Tests option. Related Samples, the newer item in the same submenu, has its own dialog and output layout.
When does the paired t-test fit this example better?
When the question concerns the mean change and a few extreme changes do not dominate the differences. Its output gives the mean difference with a 95% confidence interval, which the Wilcoxon tables do not contain. In this example the mean difference is 13.90 points, close to the median of 14.
What does a rank-biserial correlation of .90 say here?
SPSS prints none for this test. A matched-pairs rank-biserial correlation can be computed from the two sums of ranks in the Ranks table, and here it is .90 (Kerby, 2014): nearly all of the rank weight lies with the higher after-training scores. An interval needs a bootstrap or other software.
How are 19 rises, 1 fall and 1 tie written up in APA 7?
Lead with the direction counts and the median change, then the test and its effect size. Of 21 participants, 19 scored higher after training, 1 lower and 1 the same, with a median change of 14 points. A Wilcoxon signed-rank test on the 20 untied pairs gave Z = -3.53, p < .001, matched-pairs rank-biserial correlation = .90.
NEXT STEP
Need Paired Scores Ranked,
Run or Checked?
OnlineSPSS is a statistical consultancy for researchers. Share your design and dataset, and a statistically trained Research Coordinator reviews it. The scope and one fixed project fee are confirmed before work begins.
No Commitment Required
Strictly Confidential
Fixed Project Fee
In-House PhD-Level Statisticians
Same-Day Response
Serving Researchers Since 2014